
Bihourly Subterranean Temperature and Relative Humidity Data from the Nullarbor Plain, Australia (Nov 2019–Mar 2021)


Anton Melik Geographical Institute, Research Centre of the Slovenian Academy of Sciences and Arts (ZRC SAZU), Novi trg 2, 1000 Ljubljana, Slovenia
*
Author to whom correspondence should be addressed.
Data 2022, 7(3), 30; https://doi.org/10.3390/data7030030
Submission received: 13 January 2022
/
Revised: 25 February 2022
/
Accepted: 26 February 2022
/
Published: 1 March 2022
(This article belongs to the Section Spatial Data Science and Digital Earth)
Abstract
:This research provides bihourly temperature and relative humidity data from ten measuring locations in eight caves from one of the largest contiguous arid karst areas in the world, the Nullarbor Plain in south Australia. The current data span the period from November 2019 to March 2021, and represent the first continuous published monitoring of the subterranean features in this area. The data were recorded using ten TGP-4500 Tinytag Plus 2 self-contained temperature (resolution ±0.01 °C or better with a reading range from −25 °C to +85 °C) and relative humidity (resolution ±3.0% or better with a reading range from 0% to 100%) data loggers and are available in the form of a spreadsheet. The text also describes reported (but only occasional) visits to the caves, so that the data for those particular days and/or hours can be treated as anthropogenically influenced. The data have great potential to provide insight into underground karst processes, air mass movements, hydrogeology, speleothems and (palaeo)climate, current climatic changes, and biology.
Dataset: Lipar, Matej; Ferk, Mateja (2021): Bihourly temperature and humidity measurements in caves and blowholes on the Nullarbor Plain, Australia. PANGAEA, https://doi.pangaea.de/10.1594/PANGAEA.939075 (accessed on 12 January 2022).
Dataset License: CC-BY: Creative Commons Attribution 4.0 International.
Keywords:
climate data; climate monitoring; temperature; relative humidity; cave; blowhole; subterranean; karst; Australia; Nullarbor Plain1. Summary
The monitoring of temperature and relative humidity of caves is a vital factor for understanding subterranean climatic systems and their relation to exterior climate. Cave temperature is generally connected with the external climate [1] and can reflect the mean annual temperature of the surface [2]. Deep parts of caves are generally characterized by relatively constant temperatures and relative humidity near saturation point [3], whilst airflow and ventilation can be profound in shallower parts of caves or closer to their entrances [4].
Temperature and relative humidity data are an integral part of understanding the development of speleothems [5], climate-sensitive cave fauna [4], tourist impact [4], and radon emanations [6]. Meteorological data from cave environments are also filtered by high-frequency daily noises on the surface, which, in the long run, provide reliable information of global climatic changes [1,7,8].
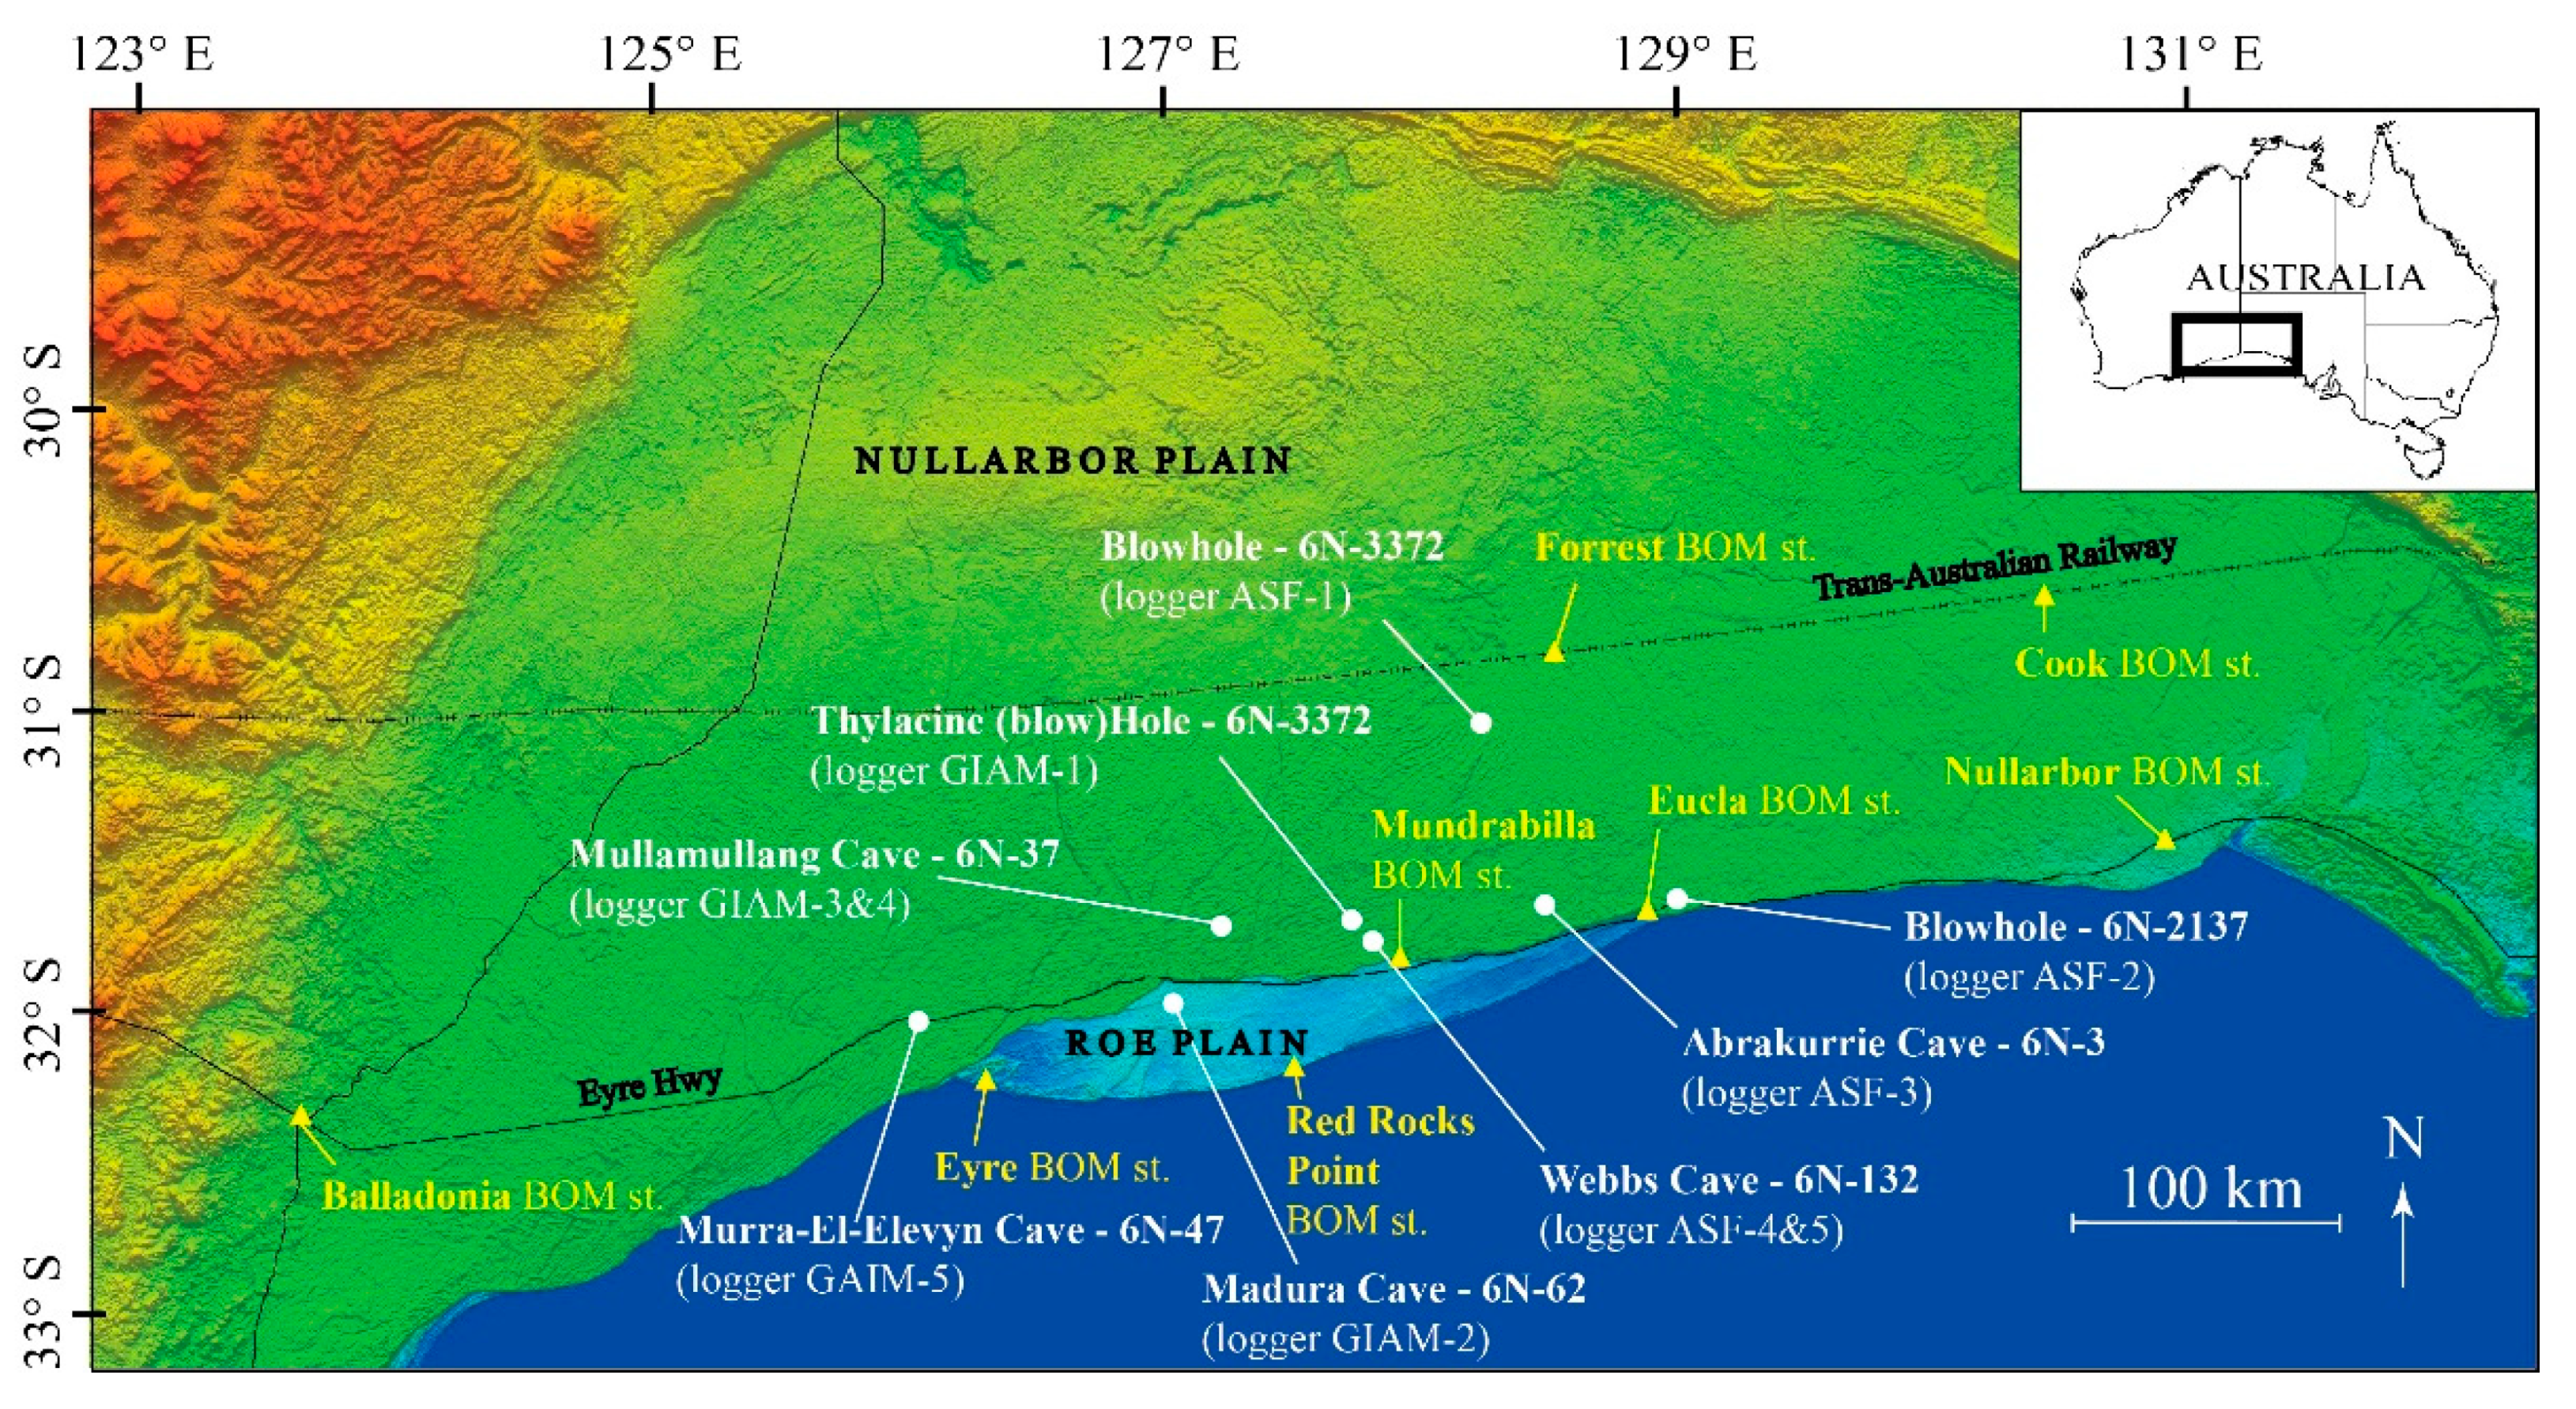
The Nullarbor Plain is a vast, approximately 200,000 km2 karst area in south Australia (Figure 1) with a variety of caves, generally divided into four cave types: deep caves (generally extending more than 30 m and up to 150 m below the surface, some reaching the water table level), shallow caves (generally extending less than 30 m below the surface), blowholes (vertical dissolutional shafts marked by in-and-out draughts of air), and Thylacine type caves (characteristic for its larger collapsed room and blowhole or collapse-type roof window for its entrance) [9,10,11,12]. Precipitation on the plain is around 250–300 mm per year, whilst potential evaporation is around 2000–3000 mm [13].
Remote and vast arid regions, such as the Nullarbor Plain, offer a valuable source of climatic data due to a lack of direct anthropogenic influences, and the Nullarbor caves have been largely recognized as unique on a world-wide scale with the potential to provide new scientific insights based on their climatic data. One of the earliest recorded temperature measurements was carried out in a blowhole on the central to south-central part of the plain by Tate [14], measuring the shade temperature outside and the temperature of air coming out of the blowhole. More comprehensive meteorological data were published by Lowry [15], measuring relative humidity, temperature, air pressure, and airflow through the entrance of Lynch Cave (central part of the plain close to the railway line, see Figure 1) between 15th and 17th October 1966. In the same year, several expeditions were undertaken to Mullamullang Cave, featuring detailed measurements of temperature, relative humidity, and wind over several days [16]. Since then, only single-visit measurements have been reported from several caves (e.g., Murra-El-Elevyn [17], Webbs Cave [18]), so the overall air temperature and/or relative humidity data on the Nullarbor Plain are scarce, only taken at opportune moments, and often measured whilst people were present, which influences the resulting temperatures. In addition to air temperatures, water temperatures from several deep caves have been reported by Contos, et al. [19,20] and Buzzacott [21], with the latest data published by Buzzacott and Skrzypek [22], reporting slightly elevated water temperature anomalies.
Here, we provide the first continuous bihourly temperature and relative humidity data from November 2019 to March 2021 with descriptions of the logger locations.
2. Site and Data Description
Three loggers were positioned in three blowholes, distributed in the central southern Nullarbor Plain: Blowhole 6N-3372 located to the north, Blowhole 6N-2137 located to the east, and Thylacine Hole blowhole located to the west (Figure 1). Six loggers were positioned in four caves formed in the central southern part of the Nullarbor Plain (Abrakurrie Cave, Webbs Cave, Mullamullang Cave, Murra-el-Elevyn Cave) and one logger in a cave on the Roe Plain, a low-lying area formed during the coastal cliff retreat in the Pliocene (Madura Cave) (Table 1).
The data contain the time of measurement (GMT+8 time; i.e., Perth, Western Australia), temperature record in °C and relative humidity in %.
2.1. Blowhole Loggers
- Blowhole 6N-3372, logger ASF-1 (Figure 2). The blowhole is 4 m deep. The entrance is a circular vertical shaft about 2 m in diameter. The cave continues semi-vertically and narrows until the passage becomes unpassable for cavers. The logger is hung from the ceiling in the inner part of the blowhole around 3.5 m from the entrance.
- Blowhole 6N-2137, logger ASF-2 (Figure 3). The blowhole is about 5 m deep before the vertical shaft becomes unpassable. The shaft is circular and about 0.7 m in diameter at the entrance. The logger is suspended 4 m into the shaft.
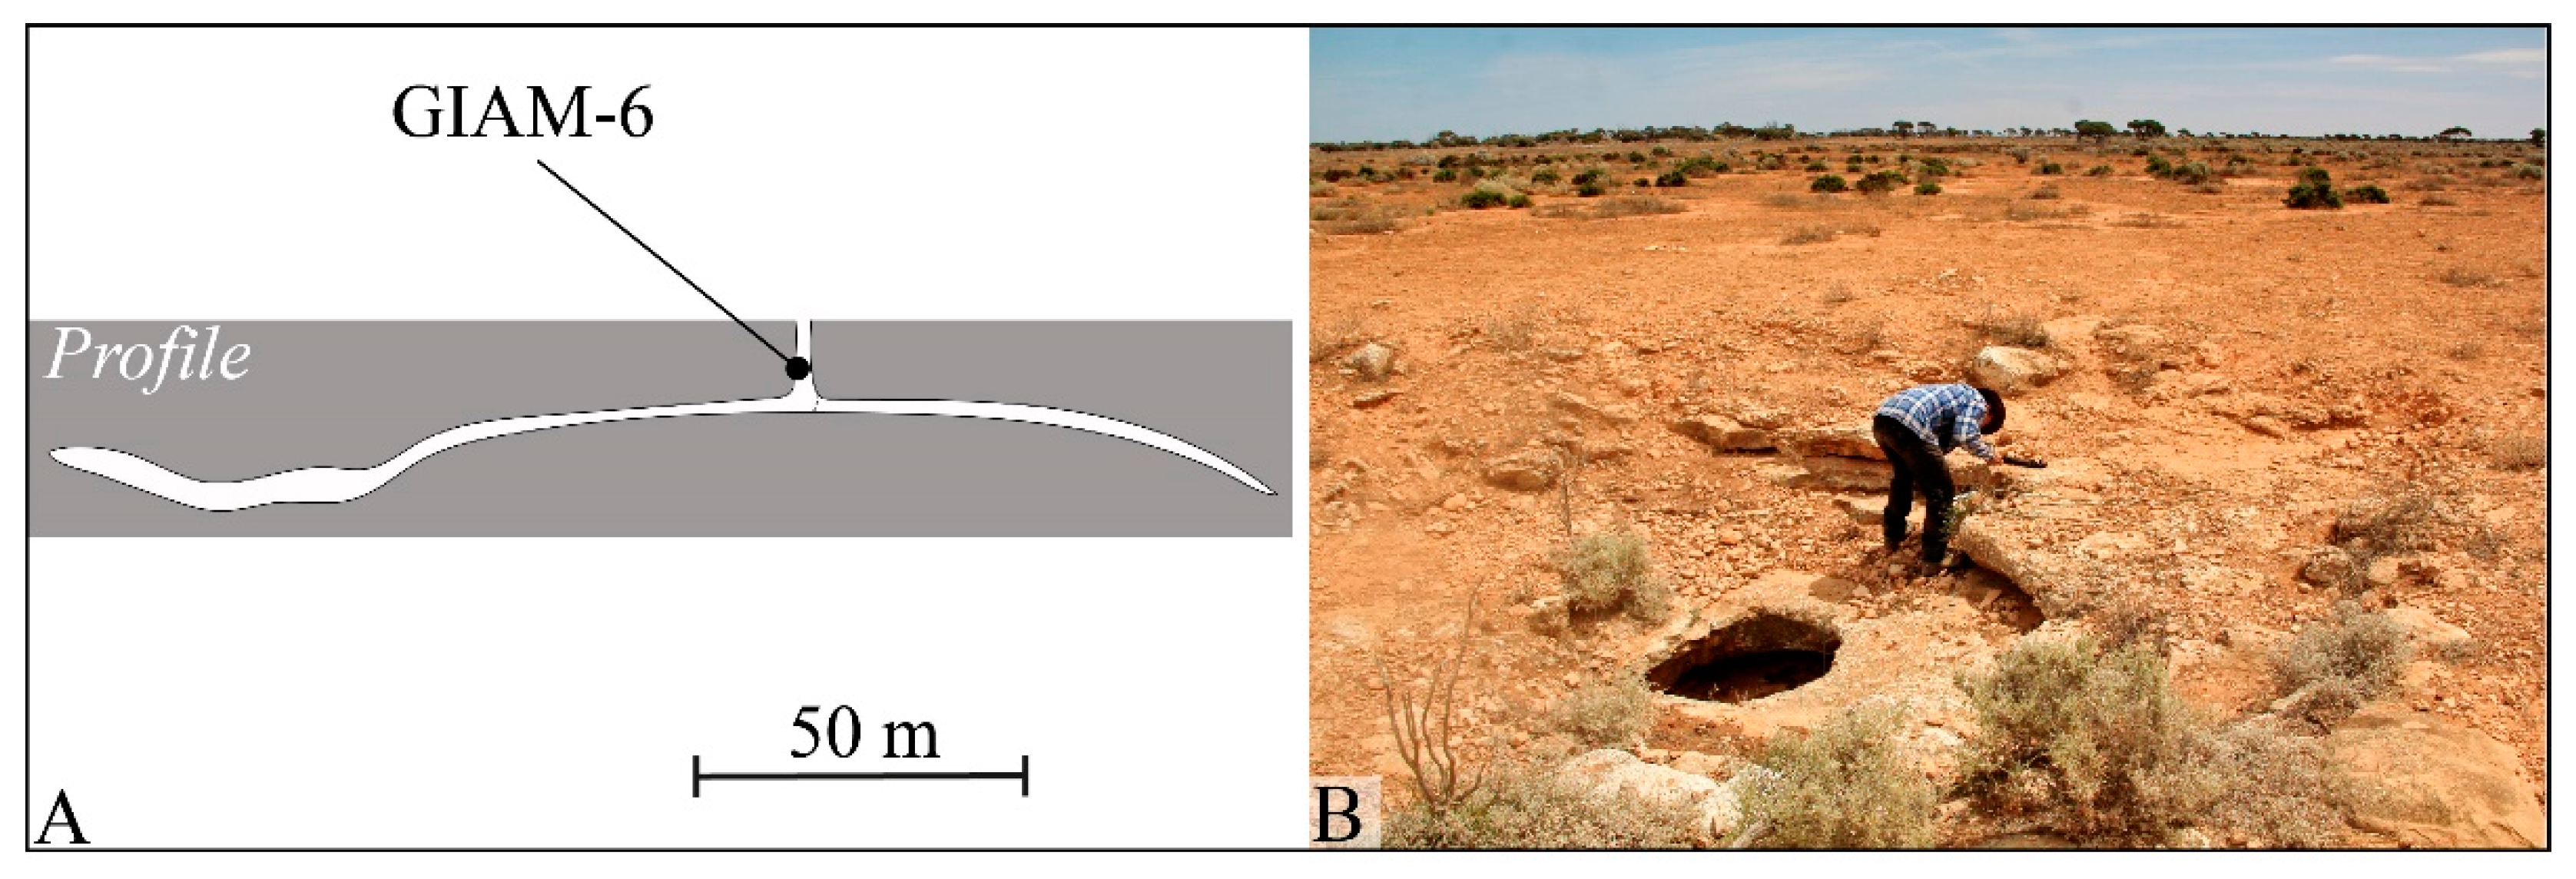
- Thylacine Hole (6N-63), logger GIAM-6 (Figure 4). The total length of the cave is 250 m and the total depth is 21 m. The entrance to the cave is a 12 m deep blowhole that is 1 m in diameter. The blowhole leads to a larger inclined/horizontal passage, generally 40 m wide and covering more than 8000 m2 [15,18], and it was used as a reference type for “The Thylacine Type” cave, with characteristic large collapse rooms with a blowhole or a collapse type of roof window at the top as their entrances [23,24]. The logger is suspended ~4 m into the entrance shaft. The cave is known for the discovery of thylacine remains there (the thylacine is an extinct carnivorous marsupial, commonly known as the Tasmanian tiger) [18,25], and has also been a subject of palynological research [26].
2.2. Cave Loggers
- Abrakurrie Cave (6N-3), logger ASF-3 (Figure 5). The cave is 470 m long and 70 m deep. The entrance to the cave opens over collapsed boulders on the southern side of an elongated collapse doline. The rocky, steeply inclined slope from the entrance changes into the gently inclined floor of the 320 m long, 35 m wide, and 15 m high main cave passage with the largest cave chamber in Australia. The main passage is mostly covered with red-brown silty stream-laid sediments and in places with rockpiles that have fallen from the roof. The sediments are the result of inwashed soil and sediment, it is estimated that around 630 tons of fine-grained deposits have accumulated in the last thirty years. The main passage is situated ~70 m below ground level and ~30 m above sea level. The cave is related to a north-south tectonic lineament [18,27,28,29] and is identified as a deep cave type. The logger is suspended on the cave wall, 1.5 m above the floor, at the furthest point of the cave from the entrance.
- Webbs Cave (6N-132), loggers ASF-4 and ASF-5 (Figure 6). The cave has more than 6 km of surveyed passages with a total depth of around 25 m [18,30]. The entrance to the cave opens at the bottom of a collapse doline. The cave layout is a spongework, featuring a network of large and small passages and is identified as a shallow cave type. The cave is characterized by its preserved black calcite speleothems (the datings span up to more than 3 Ma years [31,32,33,34]), halite speleothems [33], and anastomosing tubes [9]. The logger ASF-4 is positioned 120 m from the entrance within the cave and is attached to one of two distinctive speleothem pillars in that chamber so that it hangs 0.5 m above the floor. The logger ASF-5 is positioned 8 m from the cave entrance in the collapse doline close to the northern cave wall and hangs 0.5 m above the floor.
- Mullamullang Cave (6N-37), loggers GIAM-8 and GIAM-9 (Figure 7). The cave has more than 12 km of surveyed passages with a total depth of 135 m. It reaches the water table level at several locations, these lakes are separated by collapse passages reaching various heights above the lake levels. In addition to large collapse passages that represent most of the cave, it also has extensive levels of phreatic solution tube passages [35]. The cave is identified as a deep cave type. The cave entrance is on the northern side of a large collapse doline floor. The cave (as with many others on the Nullarbor Plain) has a pronounced inward and outward air movement, and a particular characteristic is “The Dune”, a deposition of fine-grained sediment over a mound of collapsed boulders, due to the diminished air speed after it passes through the narrow passage Southerly Buster towards the entrance part of the cave [16]. The logger GIAM-8 is positioned 800 m from the entrance within the cave on the southern cave wall (i.e., on the right side looking into the cave). It is attached to a pile of collapsed rocks and hangs 0.5 m above the cave floor. The logger GIAM-9 is positioned ~500 m from the entrance within the cave on the east cave wall (i.e., on the right side looking into the cave). It is attached to the cave wall and hangs 1 m above the cave floor.
- Murra-el-Elevyn Cave (6N-47), logger GIAM-10 (Figure 8). The cave is more than 1 km long and more than 100 m deep. The main dry passage is about 300 m long and others are interconnected passages partially or completely inundated with water [18]. The water is known to have slight variations (up to almost 1 °C) in temperature [21]. The entrance to the cave opens above collapsed boulders on the western side of a collapse doline with vertical to overhanging walls. The cave is identified as a deep cave type. The floor of the cave has an extensive layer of guano [34] and has also been a subject of research for guano minerals [17]. The logger GIAM-10 is positioned 80 m from the cave entrance near the northern cave wall. It hangs from collapsed boulders about 3 m above the flooded cave passage (water table level).
- Madura Cave (6N-62), logger GIAM-7 (Figure 9). This is the only logger on the Roe Plain. The cave is 450 m long and 10 m deep [18]. It is a passage network with a dry watercourse. The cave is identified as a deep cave type. The entrance to the cave is on the eastern side of a collapse doline. The cave has also been a subject of palynological research [36], a site of extinct animal fossil discoveries [25], and a site of archerite mineral discovery [37]. The logger GIAM-7 is positioned 120 m from the entrance within the cave near the southern cave wall (i.e., on the left side looking into the cave). It is attached to the cave ceiling and hangs 1 m above the cave floor.
2.3. Technical Validation
TGP-4500 Tinytag Plus 2 data loggers are configured to meet Gemini’s (Gemini Data Loggers (UK) Ltd., Chichester, UK) quoted accuracy specification during their manufacture. The variations of values throughout the year are in predicted ranges and have comparable relationships to climatic data from Eucla (Australian Government Bureau of Meteorology Station No. 11003) and Forrest (Australian Government Bureau of Meteorology station No. 11052) weather stations (see Figure 1 for locations and included mean daily temperatures from Eucla station in Figure 10B). Figure 10 shows the overall temperature variation in blowholes (A) and caves (B), and a detailed example of temperature variation in blowholes and the entrance part of Webbs cave (C), which shows overall correlation. The temperature variation represents the air flow into and out of the caves/blowholes.
The measured temperatures are also in accordance with previously published data. For example, the multiple-day measurement data of Mullamullang Cave (January 1966; location close to the logger GIAM-8) [16] showed variations between 16.7 °C to 17.8 °C, whilst our data show January variations between 16.1 °C to 17.4 °C (2020) and 15.8 °C to 17.1 °C (2021). The temperature and relative humidity range of Murra-El-Elevyn (13.1 °C to 18.9 °C, 45.3% to 89.6%) corresponds to a single-visit measurement of 18.3 °C and 88% (measured in the 1970s) [17]. Concerning Webbs Cave, the reported single-visit temperature measurement of 20 °C and relative humidity of 52% [18] (unknown cave location and time) can only be correlated to the range of data measured by the logger closer to the entrance (5.7 °C to 20.1 °C and 29.5% to 100%), whilst the logger deeper in the cave only recorded temperature range between 17.3 °C to 18.5 °C.
Notes were placed next to the loggers, which instruct occasional visitors to record and report the date and time when the notes are seen because the presence of humans can alter the measurements. We received three reports for the measurement period between November 2019 and March 2021 for Abrakurrie Cave (see Figure 10D for an illustration of the resulting temperature alteration), and two reports for Murra-el-Elevyn Cave (Table 2).
3. Methods
Ten TGP-4500 Tinytag Plus 2 self-contained temperature (resolution ±0.01 °C or better with a reading range from −25 °C to +85 °C) and relative humidity (resolution ±3.0% or better with a reading range from 0% to 100%) (Figure 11) data loggers were installed in eight caves and blowholes of the Nullarbor Plain to record bihourly data (i.e., data is stored as an instantaneous measurement at each 2-h). The temperature sensor type is a 10K NTC Thermistor with the response time 25 min to 90% FSD in moving air, and is internally mounted, whilst the RH sensor type is Capacitive with the response time 40 s to 90% FSD and is externally mounted. The loggers operate from ½AA 3.6 V Lithium batteries and record data at bihourly intervals. The data is stored in the loggers and needs to be manually downloaded using a CAB-0007-USB: Tinytag Ultra/Plus/View USB Download Cable and SWCD-0040 Tinytag Explorer software. Possible drifts in long-time measurements depend on the level of contamination, however, assumed on the manufacturer’s experience, around 80% of loggers are still in specification limits after the year of measurements.
To assess the inter-logger variability, the loggers were placed on the single table in the laboratory room for 13 days (hourly measuring interval), 9 days under natural relatively stable room temperature (~20 °C), and 4 days under periodically raised room temperatures (up to ~23 °C). Based on the mean recorded temperatures and relative humidity, 5 individual loggers varied both in higher and lower temperatures, and 6 individual loggers varied both in higher and lower relative humidity data. Three of the loggers malfunctioned and the data was lost. The loggers were subsequently replaced by the new ones. Variable deviating values above and below the mean values within individual loggers indicate that they cannot be ascribed a constant error value compared to the all-mean values. Instead, the maximum deviating values should be accounted as errors: Up to 0.15 °C for the temperature and up to 1.0% for relative humidity.
All the loggers ran on GMT+8 time with a maximum 7-min lag among each other. Each device was hung from a rope to avoid contact with the bedrock. Three of the loggers were installed in three different blowholes, and the rest were installed in five different caves, with two caves having two loggers installed (in the front and back parts of the caves). The digital database of cave locations from the Australian Speleological Federation (ASF) was used, including hard copies of cave maps, but due to increased vandalism and consequently in terms of cave protection, only the approximate location data are provided. For the exact coordinates, the reader is referred to ASF for relevant permits.
Author Contributions
M.L. and M.F. contributed equally to conducting this research and writing the research paper. All authors have read and agreed to the published version of the manuscript.
Funding
This research was funded by the Slovenian Research Agency (P6-0101, I0-0031, and N1-0162) and by the Australian Speleological Federation Karst Conservation Fund.
Institutional Review Board Statement
Not applicable.
Informed Consent Statement
Not applicable.
Data Availability Statement
Data supporting reported results can be found in PANGAEA repository (https://doi.pangaea.de/10.1594/PANGAEA.939075) (accessed on 12 January 2022).
Acknowledgments
The assistance of cavers is gratefully acknowledged, in particular, Ian Collette is thanked for his assistance with collecting data in the field.
Conflicts of Interest
The authors declare no conflict of interest.
References
- Badino, G. Cave temperatures and global climatic change. Int. J. Speleol. 2004, 33, 103–113. [Google Scholar] [CrossRef]
- Sánchez-Fernández, D.; Rizzo, V.; Bourdeau, C.; Cieslak, A.; Comas, J.; Faille, A.; Fresneda, J.; Lleopart, E.; Millán, A.; Montes, A.; et al. The deep subterranean environment as a potential model system in ecological, biogeographical and evolutionary research. Subterr. Biol. 2018, 25, 1. [Google Scholar] [CrossRef]
- Culver, D.C.; Pipan, T. The Biology of Caves and Other Subterranean Habitats; Oxford University Press: Oxford, UK, 2009; p. 254. [Google Scholar] [CrossRef] [Green Version]
- De Freitas, C.R.; Littlejohn, R.N. Cave climate: Assessment of heat and moisture exchange. J. Climatol. 1987, 7, 553–569. [Google Scholar] [CrossRef]
- Forbes, J. Air temperature and relative humidity study: Torgac Cave, New Mexico. J. Cave Karst Stud. 1998, 60, 27–32. [Google Scholar]
- Šebela, S.; Turk, J. Local characteristics of Postojna Cave climate, air temperature, and pressure monitoring. Theor. Appl. Climatol. 2011, 105, 371–386. [Google Scholar] [CrossRef]
- Šebela, S.; Turk, J. Air temperature characteristics of the Postojna and Predjama cave systems. Acta Geogr. Slov. 2011, 51, 43–64. [Google Scholar] [CrossRef] [Green Version]
- Mammola, S.; Piano, E.; Cardoso, P.; Vernon, P.; Domínguez-Villar, D.; Culver, D.C.; Pipan, T.; Isaia, M. Climate change going deep: The effects of global climatic alterations on cave ecosystems. Anthr. Rev. 2019, 6, 98–116. [Google Scholar] [CrossRef]
- Webb, J.A.; James, J.M. Karst evolution of the Nullarbor Plain, Australia. In Perspectives on Karst Geomorphology, Hydrology, and Geochemistry—A Tribute Volume to Derek C. Ford and William B. White: Geological Society of America Special Paper 404; Harmon, R.S., Wicks, C., Eds.; Geological Society of America: Boulder, CO, USA, 2006; Volume 404, pp. 65–78. [Google Scholar]
- Lipar, M.; Ferk, M.; Lojen, S.; Barham, M. Sulfur (34S/32S) isotope composition of gypsum and implications for deep cave formation on the Nullarbor Plain, Australia. Int. J. Speleol. 2019, 48, 1–9. [Google Scholar] [CrossRef]
- Doerr, S.H.; Davies, R.R.; Lewis, A.; Pilkington, G.; Webb, J.A.; Ackroyd, P.J.; Bodger, O. Origin and karst geomorphological significance of the enigmatic Australian Nullarbor Plain ‘blowholes’. Earth Surf. Processes Landf. 2012, 37, 253–261. [Google Scholar] [CrossRef]
- Burnett, S.; Webb, J.A.; White, S. Shallow caves and blowholes on the Nullarbor Plain, Australia—Flank margin caves on a low gradient limestone platform. Geomorphology 2013, 201, 246–253. [Google Scholar] [CrossRef]
- Bureau of Meteorology. Climate Statistics for Australian Locations; Australian Government: Canberra, Australia, 2021.
- Tate, R. The natural history of the country around the head of the Great Australian Bight. Trans. Proc. Rep. Philos. Soc. Adel. S. Aust. 1879, 2, 94–128. [Google Scholar]
- Lowry, D.C. The origin of blow-holes and the development of domes by exsudation in caves of the Nullarbor Plain. Geol. Surv. West. Aust. Annu. Rep. 1967, 78–82. [Google Scholar]
- Hill, A.L. (Ed.) Mullamullang Cave Expeditions 1966; Cave Exploration Group South Australia: Adelaide, Australia, 1966; Volume 4. [Google Scholar]
- Bridge, P.J. Guano minerals from Murra-el-elevyn Cave, Western Australia. Mineral. Mag. 1973, 39, 467–469. [Google Scholar] [CrossRef]
- Pilkington, G.; Mott, K. Nullarbor Caving Atlas; Cave Exploration Group (South Australia): Adelaide, Australia, 1986; Volume 7. [Google Scholar]
- Contos, A.; James, J.; Holmes, A.; Heywood, B.; Gillings, M.; Rogers, P.; Stone, D. Calcite Biomineralisation in the Caves of Nullarbor Plains, Australia. In Proceedings of the 13th International Congress of Speleology, Brasilia, Brazil, 15–22 July 2001; pp. 19–24. [Google Scholar]
- Contos, K.; James, J.M.; Heywood, B.; Pitt, K.; Rogers, P. Morphoanalysis of Bacterially Precipitated Subaqueous Calcium Carbonate from Weebubbie Cave, Australia. Geomicrobiol. J. 2001, 18, 331–343. [Google Scholar] [CrossRef]
- Buzzacott, P. Murra-El-Elevyn water temperature. Caves Aust. 2011, 187, 17–19. [Google Scholar]
- Buzzacott, P.; Skrzypek, G. Thermal anomaly and water origin in Weebubbie Cave, Nullarbor Karst Plain, Australia. J. Hydrol. Reg. Stud. 2021, 34, 100793. [Google Scholar] [CrossRef]
- Lowry, D.C. Geology of the Western Australian Part of the Eucla Basin; Geological Survey of Western Australia: Perth, Australia, 1970; Volume 122, pp. 1–200. [Google Scholar]
- Gillieson, D.S.; Spate, A. The Nullarbor Karst. In Geology, Climate, Hydrology and Karst Formation: Field Symposium in Australia; Gillieson, D.S., Ed.; Department of Geography and Oceanography, University College, Australian Defence Force Academy: Canberra, Australia, 1992; Volume 4, pp. 65–99. [Google Scholar]
- Gale, S.J. Event chronostratigraphy: A high-resolution tool for dating the recent past. Quat. Geochronol. 2009, 4, 391–399. [Google Scholar] [CrossRef]
- Ingram, B.S. Sporomorphs from the desiccated carcasses of mammals from Thylacine Hole, Western Australia. Helictite 1969, 7, 62–66. [Google Scholar]
- Grodzicki, J. Genesis of Nullarbor Plain caves in southern Australia. Z. Geomorphol. 1985, 29, 37–49. [Google Scholar]
- Gillieson, D.S.; Cochrane, J.A.; Murray, A. Surface hydrology and soil movement in an arid karst: The Nullarbor Plain, Australia. Environ. Geol. 1994, 23, 125–133. [Google Scholar] [CrossRef]
- Jennings, J.N. The limestone geomorphology of the Nullarbor Plains (Australia). In Proceedings of the 2nd International Congress of Speleology, Bari, Italy, 5–12 October 1958; pp. 371–386. [Google Scholar]
- Pryke, A. Webbs Cave 6N132, Nullarbor Plain, Western Australia (Map); Cave Exploration Group (South Australia) and Sydney University Speleological Society: Adelaide/Sydney, Australia, 2017. [Google Scholar]
- Goede, A.; Harmon, R.S.; Atkinson, T.C.; Rowe, P.J. Pleistocene climatic change in Southern Australia and its effect on speleothem deposition in some Nullarbor caves. J. Quat. Sci. 1990, 5, 29–38. [Google Scholar]
- Woodhead, J.D.; Sniderman, J.M.K.; Hellstrom, J.; Drysdale, R.N.; Maas, R.; White, N.; White, S.; Devine, P. The antiquity of Nullarbor speleothems and implications for karst palaeoclimate archives. Sci. Rep. 2019, 9, 603. [Google Scholar] [CrossRef] [PubMed]
- Caldwell, J.R.; Davey, A.G.; Jennings, J.N.; Spate, A.P. Colour in some Nullarbor Plain speleothems. Helictite 1982, 20, 3–10. [Google Scholar]
- Webb, J.A.; Grimes, K.G.; Osborne, A.; James, J.; Reed, L.; Gillieson, D.; Hall, L.S.; Richards, G.; Eberhard, S.; Humphreys, W.F.; et al. Beneath the Surface; Finlayson, B., Hamilton-Smith, E., Eds.; University of New South Wales Press Ltd.: Sydney, Australia, 2003; p. 182. [Google Scholar]
- Hunt, G.S. The origin and development of Mullamullang cave N37, Nullarbor Plain, Western Australia. Helictite 1970, 8, 3–26. [Google Scholar]
- Martin, H.A. Palynology and Historical Ecology of Some Cave Excavations in the Australian Nullarbor. Aust. J. Bot. 1973, 21, 283–316. [Google Scholar] [CrossRef]
- Bridge, P.J. Archerite, (K,NH4)H2PO4, a new mineral from Madura, Western Australia. Mineral. Mag. 1977, 41, 33–35. [Google Scholar] [CrossRef]
Figure 1.
Locality map of the Nullarbor Plain with cave locations (white circles) and relevant Australian Bureau of Meteorology external meteorological stations (yellow triangles). To prevent cave vandalism, the exact cave locations can be obtained on request from Australian Speleological Federation (ASF). Digital Elevation Map data from NASA’s Shuttle Radar Topography Mission (SRTM) in 3 arc-second resolution accessed through the Global Mapper online data source.

Figure 2.
ASF-1 logger in Blowhole 6N-3372. Cave map (A) sketched from the original drawn by Ian Collette; photograph (B) taken in 2019 by Lipar, M.
Figure 2.
ASF-1 logger in Blowhole 6N-3372. Cave map (A) sketched from the original drawn by Ian Collette; photograph (B) taken in 2019 by Lipar, M.

Figure 3.
ASF-2 logger in Blowhole 6N-2137. Cave map (A) sketched from observations on field; photograph (B) taken in 2019 by Ferk, M.
Figure 3.
ASF-2 logger in Blowhole 6N-2137. Cave map (A) sketched from observations on field; photograph (B) taken in 2019 by Ferk, M.

Figure 4.
GIAM-6 logger in Thylacine Hole. Cave map (A) modified from Pilkington and Mott (1986) [18]; photograph (B) taken in 2019 by Ferk, M.
Figure 4.
GIAM-6 logger in Thylacine Hole. Cave map (A) modified from Pilkington and Mott (1986) [18]; photograph (B) taken in 2019 by Ferk, M.

Figure 5.
ASF-3 logger in Abrakurrie Cave. Cave map (A) modified from Pilkington and Mott (1986) [18]; photograph (B) taken in 2019 by Lipar M., photograph (C) taken in 2011 by Lipar, M., photograph (D) taken in 2021 by Collette, I.
Figure 5.
ASF-3 logger in Abrakurrie Cave. Cave map (A) modified from Pilkington and Mott (1986) [18]; photograph (B) taken in 2019 by Lipar M., photograph (C) taken in 2011 by Lipar, M., photograph (D) taken in 2021 by Collette, I.

Figure 6.
ASF-4 and ASF-5 loggers in Webbs Cave. Cave map (A) modified from the original drawn by Alan Pryke; photographs (B–D) taken in 2019 by Lipar, M.
Figure 6.
ASF-4 and ASF-5 loggers in Webbs Cave. Cave map (A) modified from the original drawn by Alan Pryke; photographs (B–D) taken in 2019 by Lipar, M.

Figure 7.
GIAM-8 and GIAM-9 loggers in Mullamullang Cave. Cave map (A) modified from Hill (1966) [16]; photograph (B) taken in 2019 by Lipar, M., photographs (C,D) taken in 2021 by Collette, I.
Figure 7.
GIAM-8 and GIAM-9 loggers in Mullamullang Cave. Cave map (A) modified from Hill (1966) [16]; photograph (B) taken in 2019 by Lipar, M., photographs (C,D) taken in 2021 by Collette, I.

Figure 8.
GIAM-10 logger in Murra-El-Elevyn Cave. Cave map (A) modified from Pilkington and Mott (1986) [18]; photograph (B) taken in 2019 by Ferk, M., photograph (C) taken in 2011 by Lipar, M., photograph (D) taken in 2019 by Lipar, M.
Figure 8.
GIAM-10 logger in Murra-El-Elevyn Cave. Cave map (A) modified from Pilkington and Mott (1986) [18]; photograph (B) taken in 2019 by Ferk, M., photograph (C) taken in 2011 by Lipar, M., photograph (D) taken in 2019 by Lipar, M.

Figure 9.
GIAM-7 logger in Madura Cave. Cave map (A) modified from Pilkington and Mott (1986) [18]; photographs (B,D) taken in 2019 by Lipar, M., photograph (C) taken in 2021 by Collette I.
Figure 9.
GIAM-7 logger in Madura Cave. Cave map (A) modified from Pilkington and Mott (1986) [18]; photographs (B,D) taken in 2019 by Lipar, M., photograph (C) taken in 2021 by Collette I.

Figure 10.
Graphs of temperature and relative humidity variation in blowholes (A) and caves (B). Note the additional data of the rainfall amount (graphical illustration only) (Graph (A)) and mean daily temperature (Graph (B)) from Eucla terrestrial meteorological station (Australian Bureau of Meteorology) for comparative visualization. Some of the high rainfall events correspond to relative humidity readings of Blowhole 6N-2137 and Thylacine Hole to show sudden 100% RH, 0%RH or just above 0%RH, which happens when the sensor becomes saturated due to the contact with rain water. The more severe interference was noted in the last 2–3 months of the reading, which were filtered off from the graph. Graph (C) shows temperature variations due to air movement and their correlations. Graph (D) shows a rapid rise of the temperature (up to 0.3°) due to the cave visit.


Figure 11.
Accuracy of the temperature sensor (A) and the working range for the RH sensor is shown in terms of relative humidity and temperature limits (B). Graphs provided by and used with permission of TinyTag Gemini Data Loggers UK Ltd.
Figure 11.
Accuracy of the temperature sensor (A) and the working range for the RH sensor is shown in terms of relative humidity and temperature limits (B). Graphs provided by and used with permission of TinyTag Gemini Data Loggers UK Ltd.


Table 1.
A summary of datalogger positions.
| LOGGER | Location | Chamber Type | Distance from Entrance |
|---|---|---|---|
| ASF-1 | Blowhole 6N-3372 | Inclined entrance shaft | 3.5 m |
| ASF-2 | Blowhole 6N-2137 | Vertical entrance shaft | 4 m |
| ASF-3 | Abrakurrie Cave (6N-3) | Large chamber with no visible continuations | 400 m |
| ASF-4 | Webbs Cave (6N-132) | Chamber, interconnected with multiple passages | 120 m |
| ASF-5 | Webbs Cave (6N-132) | Entrance opening on the bottom edge of the collapse doline | 8 m |
| GIAM-6 | Thylacine Hole (6N-63) | Vertical entrance shaft | 4 m |
| GIAM-7 | Madura Cave (6N-62) | Interconnected cave passage | 120 m |
| GIAM-8 | Mullamullang Cave (6N-37) | Main collapsed passage (leading further into the cave) | 800 m |
| GIAM-9 | Mullamullang Cave (6N-37) | Main collapsed passage (leading further into the cave) | 500 m |
| GIAM-10 | Murra-el-Elevyn Cave (6N-47) | Collapsed chamber/passage reaching underground water | 80 m |
Table 2.
Reported visits to the caves.
| Cave | Visit Time and Duration | Number of People |
|---|---|---|
| Abrakurrie Cave | 31 May 2020, 11:45–12:15 | 4 |
| Abrakurrie Cave | 15 July 2020, up to 3 h during the day | 10–12 |
| Abrakurrie Cave | 21 August 2020, 9:15–9:45 | 1 |
| Murra-el-Elevyn Cave | 4 November 2020–multiple times during the day | Exact number unknown (~5) |
| Murra-el-Elevyn Cave | 5 November 2020–multiple times during the day | Exact number unknown (~5) |
Publisher’s Note: MDPI stays neutral with regard to jurisdictional claims in published maps and institutional affiliations. |
© 2022 by the authors. Licensee MDPI, Basel, Switzerland. This article is an open access article distributed under the terms and conditions of the Creative Commons Attribution (CC BY) license (https://creativecommons.org/licenses/by/4.0/).
Share and Cite
MDPI and ACS Style
Lipar, M.; Ferk, M. Bihourly Subterranean Temperature and Relative Humidity Data from the Nullarbor Plain, Australia (Nov 2019–Mar 2021). Data 2022, 7, 30. https://doi.org/10.3390/data7030030
AMA Style
Lipar M, Ferk M. Bihourly Subterranean Temperature and Relative Humidity Data from the Nullarbor Plain, Australia (Nov 2019–Mar 2021). Data. 2022; 7(3):30. https://doi.org/10.3390/data7030030
Chicago/Turabian StyleLipar, Matej, and Mateja Ferk. 2022. "Bihourly Subterranean Temperature and Relative Humidity Data from the Nullarbor Plain, Australia (Nov 2019–Mar 2021)" Data 7, no. 3: 30. https://doi.org/10.3390/data7030030