US6928182B1 - Imaging - Google Patents
Imaging Download PDFInfo
- Publication number
- US6928182B1 US6928182B1 US09/807,396 US80739601A US6928182B1 US 6928182 B1 US6928182 B1 US 6928182B1 US 80739601 A US80739601 A US 80739601A US 6928182 B1 US6928182 B1 US 6928182B1
- Authority
- US
- United States
- Prior art keywords
- image
- edge
- discontinuity
- domain
- function
- Prior art date
- Legal status (The legal status is an assumption and is not a legal conclusion. Google has not performed a legal analysis and makes no representation as to the accuracy of the status listed.)
- Expired - Fee Related
Links
Images


Classifications
-
- G—PHYSICS
- G06—COMPUTING; CALCULATING OR COUNTING
- G06T—IMAGE DATA PROCESSING OR GENERATION, IN GENERAL
- G06T7/00—Image analysis
- G06T7/10—Segmentation; Edge detection
- G06T7/12—Edge-based segmentation
-
- G—PHYSICS
- G06—COMPUTING; CALCULATING OR COUNTING
- G06T—IMAGE DATA PROCESSING OR GENERATION, IN GENERAL
- G06T2207/00—Indexing scheme for image analysis or image enhancement
- G06T2207/10—Image acquisition modality
- G06T2207/10072—Tomographic images
-
- G—PHYSICS
- G06—COMPUTING; CALCULATING OR COUNTING
- G06T—IMAGE DATA PROCESSING OR GENERATION, IN GENERAL
- G06T2207/00—Indexing scheme for image analysis or image enhancement
- G06T2207/30—Subject of image; Context of image processing
- G06T2207/30004—Biomedical image processing
- G06T2207/30016—Brain
Definitions
- This invention relates to imaging and in particular to methods and systems for image enhancement.
- Imaging involves transfer from the object domain into the image domain, but owing to limiting factors such as the finite size of energy source, detector size, sampling frequency, display density, software filter function, and possibly partial-volume effects experienced with some imagers, an infinitely fine delta function in the object domain cannot be faithfully reproduced in the image domain. Instead, a smeared-out image, or point-spread function (PSF), is observed. Similarly, an infinitely sharp edge-response function (ERF) in the object domain becomes a smeared-out ERF in the image domain. The smearing effect becomes more intense as the adjacent ERFs of discontinuities or contrast profiles get closer to each other.
- PSF point-spread function
- a de-convolution process is applied to the image-domain results of an object-scan to derive therefrom the respective point- or line-spread function effective in the object- to image-domain transfer of one or more object-discontinuities, and to derive from said function the location in the image domain of the respective discontinuity.
- an imaging system comprising means for performing a de-convolution process on the image-domain results of an object-scan to derive therefrom the respective point- or line-spread function effective in the object- to image-domain transfer of one or more object-discontinuities, and means to derive from said function the location in the image domain of the respective discontinuity.
- the method and system of the invention enable the location of the respective discontinuity in the image domain, to be established with a high degree of accuracy. This is critical to image definition free of any substantial smearing, and to this end the location of the respective discontinuity may be derived to sub-pixel accuracy simply from the mid-point of the full-width half-maximum of said function.
- the said function may be correlated with the image-domain results of said transfer for enhancement of spatial resolution of the imaging of the one or more discontinuities.
- This enhancement may involve transfer of sub-pixels within the image-domain results of the respective one or more discontinuities, the sub-pixels being transferred within their respective image-domain results from one side to the other of said location.
- the de-convolution process may be carried out using least-squares running filtering.
- FIG. 1 illustrates schematically the method and system of the invention
- FIG. 2 illustrates features of processing performed in the method and system of FIG. 1 ;
- FIG. 3 shows results achieved from use of the method and system of FIG. 1 ;
- FIG. 4 shows to an enlarged scale a section of the contour of an image profile depicted in FIG. 2 ;
- FIGS. 5 and 6 are a plan view and sectional end-elevation elevation of a couch-top used in the method and system of FIG. 1 ;
- FIG. 7 provides illustrates of a convolution operation, as a basis for a mathematical model of de-convolution processing in accordance with the method and system of FIG. 1
- the method and system to be described with reference to FIG. 1 utilise MR scanning for medical diagnostic and treatment-planning purposes.
- the method and system of the invention can be used in other applications of MR scanning and also in circumstances where other scanning techniques are utilised.
- both structure and function are represented by discrete ‘boxes’ 1 to 19 in FIG. 1 , the method and system are to a substantial extent manifest in programmed digital data-processing operations.
- data derived in accordance with conventional operation of an MR scanner 1 is processed for imaging purposes within a processor 2 .
- the output of the processor 2 is used to provide a display 3 , and from this is subject to post-imaging processing 4 .
- the post-imaging processing 4 includes the facility for selecting a region of the display 3 for more-detailed and closer inspection.
- the imaging method and system of FIG. 1 are conventional, and it is in further processing 5 of the image data of the selected region of interest obtained by the post-imaging processing 4 that a step forward from what is already known is achieved. More particularly, the further processing 5 is operative to define more clearly the true edges or boundaries of image contour(s) in the selected region of interest, and to enhance the accuracy of the imaging of those contours.
- the definition and accuracy of transfer of features from the object domain scanned by the scanner 1 , to the image domain manifest in the post-imaging processing 4 is limited by many factors.
- PSF point-spread function
- an infinitely sharp edge-response function (ERF) or step 23 in the object domain becomes through the transfer represented by arrow 24 , a smeared-out transition 25 of spread represented by dimension arrows 26 , in the image domain.
- ERF edge-response function
- step 23 in the object domain becomes through the transfer represented by arrow 24 , a smeared-out transition 25 of spread represented by dimension arrows 26 , in the image domain.
- the smearing effect becomes more intense as adjacent ERFs of discontinuities or contrast profiles get closer to each other (or as the spatial frequency of the modulation becomes higher); this also causes loss of profile height.
- the inherent loss of the spatial resolution that is, the part that is indicated by the smeared-out effect on the corner edge of the ERF cannot be restored or partially restored even by re-scanning the image with an ultra high resolution digital scanner system.
- the further processing 5 is operative in accordance with the invention to provide accurate image-edge definition and location, and to improve spatial resolution in the imaging. More especially, in the context of FIG. 2 , the edge position corresponding to the discontinuity or step 23 of the object ERF is pin-pointed in the image domain from the mid-point of the full-width half-maximum (FWHM) of the image PSF; the pin-pointing is to sub-pixel accuracy for the image ERF. Low-contrast and ‘area’ filtering are used to remove ‘spurious’ edges, and sub-pixel sampling to detect detail to the resolution of the single-pixel modulation.
- the discontinuity or step 23 of the ERF is then restored within the image domain by removing the sub-pixel values from outside the optimum edge position to compensate for those within. It is to be noted that the sub-pixels then become pixels in display, and that the enhancement is equivalent to the performance of an extra high resolution image transfer system.
- the image ERF 25 of an infinitely-sharp step 23 can be produced by convolution of the image PSF 22 with the object ERF 23 .
- de-convolution of the image ERF 25 using sub-pixel sampling represented by the arrow 29 , reproduces the image PSF 22 in a de-convolution space as image PSF 22 ′.
- the image ERF 25 is superimposed on the PSF 22 ′ within this space as image ERF 25 ′, and the optimum edge-position 30 is derived from the mid-point of the FWHM of the image PSF 22 ′, and is pin-pointed to sub-pixel accuracy.
- the operation in accordance with the invention is relatively simple, as only either the x- or the y-profile, that is to say a line spread function LSF is involved. But for two-dimensional operations, both the x- and y-profiles, and if necessary, the xy-diagonal profiles to eliminate any possible streakings in the image, may be used; in this case, a proper weighting scheme will be required to re-construct the image.
- the enhancement of spatial resolution in display 7 reproduces the region of interest selected from display 3 , without blurring (or step) effects at the profile edge.
- FIG. 3 is illustrative of some of the low-contrast results provided in practice from MR scanning of a pig's brain in fluid.
- Curve A is the image ERF produced
- curve B is the line spread function (LSF) resulting from de-convolution of curve A carried out in processing 5 .
- the optimum edge-position is established from the mid-point C of the FWHM of curve B, and the additional re-processing 6 is operative by means of sub-pixel transfer, to re-construct curve A to conform substantially to the edge-feature from which it originated in the display 7 .
- curve B is nonetheless smooth and that mid-point C is located to sub-pixel accuracy. Furthermore curve B indicates a sensitivity of more than 8:1 between the profile-height and background noise.
- the complete profile 35 of an image within the selected area of interest of display 3 is built up as indicated by arrow 36 , from the edge-position data derived within processing 5 .
- This data identifies the location of the point 30 , together with the locations of all corresponding points derived from sampling the multiple x- or y-profiles of the selected area of interest.
- the build up and display of these points from the data takes place in display 8 so that a substantially true contour 37 for the profile 35 is defined.
- the sharpness of the true contour 37 is in contrast to the smeared contour that without de-convolution would have been obtained by virtue of the spread (represented by the arrows 26 ) of the relevant image ERFs 25 .
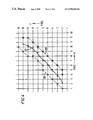
- a small portion of the contour 37 is shown enlarged in FIG. 4 and is defined as a best-fit line between optimum edge-positions derived respectively from x- and y-profiles; the x-profile positions are indicated by black dots and the y-profile positions by white dots.
- the closeness to one another of corresponding positions in the x- and y-profiles is indicative of the accuracy to sub-pixel level achieved.
- the smear-out that would have been manifest in the image-profile contour if the de-convolution technique were not used, would have extended throughout the space bounded by the dashed lines 38 and 39 ; these boundaries are indicated in dashed line in the representation of profile 35 in FIG. 2 .
- the accurate definition of the image contour 37 derived in the display 8 allows correspondingly accurate determination in calculation 9 of the area within that contour; the volume involved can also be derived from successive slices scanned.
- the determination of area and volume is especially useful for diagnostic and accurate assessment 10 of the size of a tumour or lesion before and after treatment. It is similarly useful for assessment of arterial dimensions in angiography.
- the accurate definition of the image contour 37 derived in the display 8 is particularly useful for segmenting anatomical structures for diagnostic and treatment planning 11 .
- the ratio of intensities of two scans are derived by processing 12 to derive values of relaxation times T 1 , and T 2 , and of proton density.
- the values are then represented in display 13 within the boundary of the image contour, utilising standardisation data derived from a couch-top 14 used within the scanner 1 .
- the couch-top 14 which also provides landmarks for determining position coordinates, has the form shown in FIGS. 5 and 6 , and will now be described.
- the couch-top 40 which is of polystyrene bubble foam, has the form of a flat slab, and is supported on a curved foam base 41 that fits to the scanner table of the MR installation.
- Two zig-zag runs of tubing 42 are embedded within the top 40 to extend along the length of the couch either side of centrally-embedded straight tubing 43 .
- the tubing 42 of each zig-zag run is of double-bore rectangular cross-section, whereas the tubing 43 is of single-bore cross-section.
- the five bores defined by the array of tubing 42 and 43 may be filled respectively with the five MR solutions S 0 to S 4 of Table I, for standardization and calibration purposes.
- the four MnCl 2 .4H 2 O solutions, S 1 to S 4 cover the full range of values of T 1 , and T 2 for anatomical tissues, and the fifth solution, S 0 , of CuSO 4 .5H 2 O, is nominally equivalent to “loosely bound water”.
- the tissue types revealed by the T 1 , T 2 and proton density values in display 13 are determined by processing 15 from look-up tables, and tissue densities are assigned within the image-contour boundaries in display 16 .
- the images of display 16 are furthermore corrected empirically for geometry distortion in accordance with data supplied from memory 17 .
- the data stored in memory 17 is derived using a set of drum phantoms of the spider-web form, and correction for geometry distortion is realistically effective principally because of the accuracy and spatial resolution with which image-contours are defined.
- the tissue types assigned to the corrected images are utilised in display 16 through the Bulk Heterogeneity Correction method described by Richard A, Geise et al, Radiology, 124:133-141, July, 1977, to establish for each image a normalised tissue density value; the up-datable look-up table for this is stored in memory 18 . Accordingly, the display 16 when used at step 19 in conjunction with the positional datums derived from the couch 14 , has all the tissue contours accurately mapped out with their respective tissue densities and locations. This establishes an accurate and readily-usable, stand-alone alone basis for diagnosis and treatment planning, and enables a true three-dimensional assessment and plan to be made when both orthogonal and oblique MR images are involved.
- the method and system of the invention have been described above in the medical context they are applicable more widely than this, for example, in engineering, in physical science and in the field of instrumentation generally. Moreover, the method and system is not limited to MR imaging, but may be utilised where other forms of imaging are involved.
- CT computer assisted tomography
- Other forms of imaging to which the invention is applicable include X-ray radiography, film- or print-image transformation to digital form, digital X-ray fluorography, ultra-sound imaging, nuclear medicine, positron emission tomography (PET) and other camera or imaging.
- PET positron emission tomography
- the technique is particularly suitable for use in X-ray digital fluorography, in which small structures under study are highlighted by injection of contrast liquids; the small structures may also be isolated from surrounding interfering effects by using an image subtraction technique.
- the invention is applicable to one-dimensional imaging as used, for example, in regard to bar-code patterns, the spectrum of DNA analysis, iris patterns of eyes (for example, for identification purposes in commercial banking), finger-print identification, and emission spectroscopy.
- the invention is also applicable to two-dimensional imaging, for example, in relation to images obtained by satellite or pattern recognition, or from a surveillance camera or during laboratory experimentation.
- the invention is applicable where there needs to be accurate determination of the edge position in an image versus the true object-edge position, for the purpose, for example, of measurement of the positional displacement between object and image, distortion correction and manufacturing control.
- the major contribution to the magnetic-resonance (MR) signal comes from the abundant protons content of water molecules and protein. It is a quantum process at the Larmor frequency according to the magnetic field in use.
- the ‘T 1 -weighted’ and ‘T 2 -weighted’ MR signals from protons provide contrast numbers that are relative in scale, whereas in CT, the X-ray absorption is a polychromatic attenuation process affected by the electron densities of all the atoms presented within the X-ray beam. There is no equation to correlate the CT number (or the linear attenuation coefficient, electron density, or tissue density) with the MR-contrast numbers; no direct calibration between the two types of signal is possible.
- CT and MR signals act against their use in combination for imaging purposes, but the present invention provides a method and system by which the advantages of each may be utilised to improve image resolution and contrast information.
- CT provides a high spatial resolution but only in regard to view normal to the transverse slice.
- Resolution for all re-constructed non-transverse planes is poor owing to the need to use elongate voxels to improve signal-to-noise ratio.
- the partial-volume effect of using elongate voxels may give rise to detection errors at the thin edge of a contrast profile of a lesion.
- MR can give the same high degree of spatial resolution viewed in the normal direction to any image-slice plane, and can also provide isotropic resolution with cubic-voxel volume imaging.
- multiple-slice transverse CT scans are collected across a section of the volume of interest in a patient or other subject.
- Corresponding multiple-slice transverse MR scans of the same volume are also collected.
- the slice thickness of the latter scans may be one half, or smaller, of the thickness of the CT slices, and may be collected two-dimensionally or three-dimensionally.
- the patient or other object scanned is constrained throughout on a couch that provides landmarks with respect to a coordinate reference arrangement on the couch-top. This is to ensure the reproducibility of, for example, anatomical positions and features to the first order accuracy for the corresponding CT and MR scans, and possibly for radiation treatment to be made.
- the respective transverse planes of the CT and MR images are processed individually in the method and are matched with one another in a de-convoluted space for the CT and MR images.
- the two sets of de-convoluted maps are then merged together to a second order of accuracy in order that the CT numbers may be transferred over to replace the corresponding MR contrast numbers.
- non-transverse (or oblique) planes can be obtained from the two-dimensional MR images, or from the re-arrangement of the corresponding voxels of the three-dimensional volume images; where two-dimensional MR is used, a further step of contrast transformation may be required.
- the respective transverse planes of CT and MR images are processed individually by using ‘boundary’ or ‘finger-print’ matching techniques in a de-convolution space for the CT & MR images.
- the skin-contour features along the sides of the patient may be best used for second-order alignment and matching purposes, as they are less affected by patient-movements. Transitional error may be readily corrected with respect to the coordinate positions of a rectangular tubing system embedded in the couch-top (for example that described above with reference to FIGS. 5 and 6 ).
- the processed data may then be used for a ‘diagnostic and statistics software package’ of CT image versus MR image for their exactly corresponding transverse slice(s), and an associated ‘statistical package’ for accurate computation of the ‘true’ area, and then the ‘true’ volume, of a lesion or tissue profile or contour.
- the two sets of de-convoluted maps may also be merged together to a second order of accuracy in order that the CT numbers may be transferred over to replace the corresponding MR contrast numbers.
- non-transverse (or oblique) planes are obtained from the two-dimensional image or from the re-arrangement of the corresponding voxels of the three-dimensional volume; in the two-dimensional MR case, a further step of contrast transformation is required.
- the transferred contrast data may then be used in a three-dimensional radiotherapy treatment planning software package for an in-plane, oblique-image pseudo-three-dimensional approach using MR images.
- LSF the same shape of LSF is recovered by the de-convolution process independently of the sense of-the ERF; it does not matter whether a roll-up or a roll-down ERF of a positive or a negative contrast profile, is involved.
- This is an important property as a positive contrast contour will have roll-up (from low to high) ERFs at both ends whereas a negative contrast contour will have roll-down (from high to low) ERFs at both ends.
- the LSF is derived from the ERF by de-convolution using a running filter. This enhances the accuracy of the method in overcoming the problem of noise that affects the digitised pixel values of the image.
- Use is made of a least-squares fitting of a set of data points that advances along the whole length of the function from one point to another.
- the gradient at dy/dx (3+n) or dy/dx (4+n) can then be derived and plotted against x for the LSF profile.
- the graph of dy/dx against x gives the LSF profile.
- the peak of this profile is located centrally of the mid-points of the ascending and descending limbs of the graph. These points define the extremes of the full-width-half-maximum (FWHM) of the profile and the mid-point of this is determined with an accuracy of sub-pixel level owing to the ‘average’ effect.
- FWHM full-width-half-maximum
- the point spread function is the two dimensional profile which may be derived, in practice, from the two corresponding LSFs orthogonal to one another within an image plane.
- the peak position of the PSF profile is, therefore, from the ‘mean’ or ‘cross-over’ of the two peaks or the two LSF profiles.
- the PSF is obtained in practice from two orthogonal axes in a two-dimensional plane.
- the generation of the LSF is, after phase-reversal correction, independent of the roll-up or roll-down nature of ERFs at the edges of the contrast contour. In other words, it is independent of the sense and the absolute value of the contrast numbers within the contour.
- the peak position of the LSF (or PSF) is the central half-way (50%) point of the roll-up or roll-down ERF which is the optimum position for true-edge definition
Abstract
A de-convolution process is applied to an MR, CT or other image (25) of a scanned-object (23) to derive the point-spread function (22′) at an object-edge and to pin-point from the mid-point of its full-width-half-maximum FWHM, the location (30) of the true image-edge. With the object-image (25′) overlying the PSF function (22′) in the de-convolution space, sub-pixels which follow location (30) are transferred to before it to re-construct the image-edge (25′) for sharper conformity to the object-edge (23). Sharp definition of image-contour (37) facilitates accurate determination of area and volume of image profiles (35) and their segmentation. The accurate image-edge definition enables viable correction of geometrical distortion in stand-alone MR diagnosis and treatment planning.
Description
This invention relates to imaging and in particular to methods and systems for image enhancement.
Imaging involves transfer from the object domain into the image domain, but owing to limiting factors such as the finite size of energy source, detector size, sampling frequency, display density, software filter function, and possibly partial-volume effects experienced with some imagers, an infinitely fine delta function in the object domain cannot be faithfully reproduced in the image domain. Instead, a smeared-out image, or point-spread function (PSF), is observed. Similarly, an infinitely sharp edge-response function (ERF) in the object domain becomes a smeared-out ERF in the image domain. The smearing effect becomes more intense as the adjacent ERFs of discontinuities or contrast profiles get closer to each other.
It is an object of the present invention to provide a method and system by which the above problem can be at least partly overcome.
According to one aspect of the present invention there is provided a method wherein a de-convolution process is applied to the image-domain results of an object-scan to derive therefrom the respective point- or line-spread function effective in the object- to image-domain transfer of one or more object-discontinuities, and to derive from said function the location in the image domain of the respective discontinuity.
According to another aspect of the invention there is provided an imaging system comprising means for performing a de-convolution process on the image-domain results of an object-scan to derive therefrom the respective point- or line-spread function effective in the object- to image-domain transfer of one or more object-discontinuities, and means to derive from said function the location in the image domain of the respective discontinuity.
The method and system of the invention enable the location of the respective discontinuity in the image domain, to be established with a high degree of accuracy. This is critical to image definition free of any substantial smearing, and to this end the location of the respective discontinuity may be derived to sub-pixel accuracy simply from the mid-point of the full-width half-maximum of said function.
The said function may be correlated with the image-domain results of said transfer for enhancement of spatial resolution of the imaging of the one or more discontinuities. This enhancement may involve transfer of sub-pixels within the image-domain results of the respective one or more discontinuities, the sub-pixels being transferred within their respective image-domain results from one side to the other of said location.
The de-convolution process may be carried out using least-squares running filtering.
An imaging method and system according to the present invention will now be described, by way of example, with reference to the accompanying drawings, in which:
The method and system to be described with reference to FIG. 1 utilise MR scanning for medical diagnostic and treatment-planning purposes. In principle and in the general techniques described, the method and system of the invention can be used in other applications of MR scanning and also in circumstances where other scanning techniques are utilised. Furthermore, although both structure and function are represented by discrete ‘boxes’ 1 to 19 in FIG. 1 , the method and system are to a substantial extent manifest in programmed digital data-processing operations.
Referring to FIG. 1 , data derived in accordance with conventional operation of an MR scanner 1 is processed for imaging purposes within a processor 2. The output of the processor 2 is used to provide a display 3, and from this is subject to post-imaging processing 4. The post-imaging processing 4 includes the facility for selecting a region of the display 3 for more-detailed and closer inspection.
To the extent the imaging method and system of FIG. 1 have so far been described, they are conventional, and it is in further processing 5 of the image data of the selected region of interest obtained by the post-imaging processing 4 that a step forward from what is already known is achieved. More particularly, the further processing 5 is operative to define more clearly the true edges or boundaries of image contour(s) in the selected region of interest, and to enhance the accuracy of the imaging of those contours.
The definition and accuracy of transfer of features from the object domain scanned by the scanner 1, to the image domain manifest in the post-imaging processing 4, is limited by many factors. The limitations arise from within the scanner 1 itself (in particular the finite size of the energy source), within the processing performed by the processor 2, and within the display 3; limitations arise inherently from, for example, the data sampling frequency and display density used, and also from the filter-function of the software involved. More particularly, and referring to FIG. 2 , an infinitely fine delta function 20 in the object domain is not faithfully reproduced in the image domain. Instead, the transfer as represented by the arrow 21 results in a point-spread function (PSF) or smeared-out image 22 in the image domain. Similarly, an infinitely sharp edge-response function (ERF) or step 23 in the object domain becomes through the transfer represented by arrow 24, a smeared-out transition 25 of spread represented by dimension arrows 26, in the image domain. When two image ERFs are close to one another, the smeared-out effects run into each other. The consequent deterioration of the spatial resolution is often monitored by the percentage modulation transfer which is given by the ratio, expressed as a percentage, of the amplitude of the modulation in the image domain to that in the object domain.
The smearing effect becomes more intense as adjacent ERFs of discontinuities or contrast profiles get closer to each other (or as the spatial frequency of the modulation becomes higher); this also causes loss of profile height. The inherent loss of the spatial resolution (that is, the part that is indicated by the smeared-out effect on the corner edge of the ERF) cannot be restored or partially restored even by re-scanning the image with an ultra high resolution digital scanner system.
The further processing 5 is operative in accordance with the invention to provide accurate image-edge definition and location, and to improve spatial resolution in the imaging. More especially, in the context of FIG. 2 , the edge position corresponding to the discontinuity or step 23 of the object ERF is pin-pointed in the image domain from the mid-point of the full-width half-maximum (FWHM) of the image PSF; the pin-pointing is to sub-pixel accuracy for the image ERF. Low-contrast and ‘area’ filtering are used to remove ‘spurious’ edges, and sub-pixel sampling to detect detail to the resolution of the single-pixel modulation. The discontinuity or step 23 of the ERF is then restored within the image domain by removing the sub-pixel values from outside the optimum edge position to compensate for those within. It is to be noted that the sub-pixels then become pixels in display, and that the enhancement is equivalent to the performance of an extra high resolution image transfer system.
As represented in FIG. 2 by the arrows 27 and 28, the image ERF 25 of an infinitely-sharp step 23 can be produced by convolution of the image PSF 22 with the object ERF 23. In accordance with the present invention, de-convolution of the image ERF 25 using sub-pixel sampling, represented by the arrow 29, reproduces the image PSF 22 in a de-convolution space as image PSF 22′. The image ERF 25 is superimposed on the PSF 22′ within this space as image ERF 25′, and the optimum edge-position 30 is derived from the mid-point of the FWHM of the image PSF 22′, and is pin-pointed to sub-pixel accuracy.
For one-dimensional cases, the operation in accordance with the invention is relatively simple, as only either the x- or the y-profile, that is to say a line spread function LSF is involved. But for two-dimensional operations, both the x- and y-profiles, and if necessary, the xy-diagonal profiles to eliminate any possible streakings in the image, may be used; in this case, a proper weighting scheme will be required to re-construct the image.
Once the original sharp-edge feature represented by the object ERF 23 is pin-pointed at the position 30 within further processing 5, that feature may be restored by additional re-processing 6 (FIG. 1). In re-processing 6, the sub-pixel values occurring ‘outside’ the optimum edge-position 30 are transferred to compensate those ‘within’. This is illustrated in FIG. 2 by arrow 31 transferring sub-pixel blocks 32 from after point 30 in the image ERF 25′, to before it. The re-construction of image ERF 25′ into image ERF 33 conforming closely in configuration to object ERF 23 is represented by arrow 34. Image ERF 33 is displayed in enlarged form in display 7 (FIG. 1).
These techniques enable substantial recovery of the loss of spatial resolution in the imaging, without the trade-off loss of other properties such as image noise. Furthermore, the enhancement of spatial resolution in display 7 reproduces the region of interest selected from display 3, without blurring (or step) effects at the profile edge.
It is to be noted that whereas curve A is stepped, curve B is nonetheless smooth and that mid-point C is located to sub-pixel accuracy. Furthermore curve B indicates a sensitivity of more than 8:1 between the profile-height and background noise.
Referring again to FIG. 2 , the complete profile 35 of an image within the selected area of interest of display 3, is built up as indicated by arrow 36, from the edge-position data derived within processing 5. This data identifies the location of the point 30, together with the locations of all corresponding points derived from sampling the multiple x- or y-profiles of the selected area of interest. The build up and display of these points from the data takes place in display 8 so that a substantially true contour 37 for the profile 35 is defined. The sharpness of the true contour 37 is in contrast to the smeared contour that without de-convolution would have been obtained by virtue of the spread (represented by the arrows 26) of the relevant image ERFs 25.
A small portion of the contour 37 is shown enlarged in FIG. 4 and is defined as a best-fit line between optimum edge-positions derived respectively from x- and y-profiles; the x-profile positions are indicated by black dots and the y-profile positions by white dots. The closeness to one another of corresponding positions in the x- and y-profiles is indicative of the accuracy to sub-pixel level achieved. The smear-out that would have been manifest in the image-profile contour if the de-convolution technique were not used, would have extended throughout the space bounded by the dashed lines 38 and 39; these boundaries are indicated in dashed line in the representation of profile 35 in FIG. 2.
The accurate definition of the image contour 37 derived in the display 8 allows correspondingly accurate determination in calculation 9 of the area within that contour; the volume involved can also be derived from successive slices scanned. The determination of area and volume is especially useful for diagnostic and accurate assessment 10 of the size of a tumour or lesion before and after treatment. It is similarly useful for assessment of arterial dimensions in angiography.
Moreover, the accurate definition of the image contour 37 derived in the display 8, is particularly useful for segmenting anatomical structures for diagnostic and treatment planning 11. Furthermore, the ratio of intensities of two scans are derived by processing 12 to derive values of relaxation times T1, and T2, and of proton density. The values are then represented in display 13 within the boundary of the image contour, utilising standardisation data derived from a couch-top 14 used within the scanner 1. The couch-top 14, which also provides landmarks for determining position coordinates, has the form shown in FIGS. 5 and 6 , and will now be described.
Referring to FIGS. 5 and 6 , the couch-top 40, which is of polystyrene bubble foam, has the form of a flat slab, and is supported on a curved foam base 41 that fits to the scanner table of the MR installation. Two zig-zag runs of tubing 42 are embedded within the top 40 to extend along the length of the couch either side of centrally-embedded straight tubing 43.
The tubing 42 of each zig-zag run is of double-bore rectangular cross-section, whereas the tubing 43 is of single-bore cross-section. The five bores defined by the array of tubing 42 and 43 may be filled respectively with the five MR solutions S0 to S4 of Table I, for standardization and calibration purposes. The four MnCl2.4H2O solutions, S1 to S4, cover the full range of values of T1, and T2 for anatomical tissues, and the fifth solution, S0, of CuSO4.5H2O, is nominally equivalent to “loosely bound water”.
| TABLE I | |||
| T1 | T2 | ||
| Solution | at 0.5T | at 0.5T | |
| S0 | 1.25 g/l CuSO4.5H2O | 200 ms | 200 ms |
| S1 | 3.41 × 10¹⁶ Mn+2 ions/ml | 840 ms | 300 ms |
| S2 | 1.15 × 10¹⁷ Mn+2 ions/ml | 440 ms | 120 ms |
| S3 | 2.30 × 10¹⁷ Mn+2 ions/ml | 250 |
60 ms |
| S4 | 4.37 × 10¹⁷ Mn+2 ions/ml | 150 |
30 ms |
The tissue types revealed by the T1, T2 and proton density values in display 13 are determined by processing 15 from look-up tables, and tissue densities are assigned within the image-contour boundaries in display 16. The images of display 16 are furthermore corrected empirically for geometry distortion in accordance with data supplied from memory 17. The data stored in memory 17 is derived using a set of drum phantoms of the spider-web form, and correction for geometry distortion is realistically effective principally because of the accuracy and spatial resolution with which image-contours are defined.
The tissue types assigned to the corrected images are utilised in display 16 through the Bulk Heterogeneity Correction method described by Richard A, Geise et al, Radiology, 124:133-141, July, 1977, to establish for each image a normalised tissue density value; the up-datable look-up table for this is stored in memory 18. Accordingly, the display 16 when used at step 19 in conjunction with the positional datums derived from the couch 14, has all the tissue contours accurately mapped out with their respective tissue densities and locations. This establishes an accurate and readily-usable, stand-alone alone basis for diagnosis and treatment planning, and enables a true three-dimensional assessment and plan to be made when both orthogonal and oblique MR images are involved.
Although the method and system of the invention have been described above in the medical context they are applicable more widely than this, for example, in engineering, in physical science and in the field of instrumentation generally. Moreover, the method and system is not limited to MR imaging, but may be utilised where other forms of imaging are involved. The steps and structure represented in FIG. 1 by ‘boxes’ 1 to 11 are just as applicable to computer assisted tomography (CT), as they are to MR imaging. Other forms of imaging to which the invention is applicable include X-ray radiography, film- or print-image transformation to digital form, digital X-ray fluorography, ultra-sound imaging, nuclear medicine, positron emission tomography (PET) and other camera or imaging. The technique is particularly suitable for use in X-ray digital fluorography, in which small structures under study are highlighted by injection of contrast liquids; the small structures may also be isolated from surrounding interfering effects by using an image subtraction technique.
The inherent resolutions of X-ray radiography, ultra-sound imaging, nuclear medicine, and PET scanning are relatively low, and some are used for real-time study. Only the individual still frame or hard-copy images may be re-processed.
In the context of engineering, physical science and the field of instrumentation, the invention is applicable to one-dimensional imaging as used, for example, in regard to bar-code patterns, the spectrum of DNA analysis, iris patterns of eyes (for example, for identification purposes in commercial banking), finger-print identification, and emission spectroscopy. The invention is also applicable to two-dimensional imaging, for example, in relation to images obtained by satellite or pattern recognition, or from a surveillance camera or during laboratory experimentation. As a general matter, the invention is applicable where there needs to be accurate determination of the edge position in an image versus the true object-edge position, for the purpose, for example, of measurement of the positional displacement between object and image, distortion correction and manufacturing control.
As a further example of application of the present invention, a method and system that uses CT and MR imaging in conjunction with one another, will now be described.
The major contribution to the magnetic-resonance (MR) signal comes from the abundant protons content of water molecules and protein. It is a quantum process at the Larmor frequency according to the magnetic field in use. The ‘T1-weighted’ and ‘T2-weighted’ MR signals from protons provide contrast numbers that are relative in scale, whereas in CT, the X-ray absorption is a polychromatic attenuation process affected by the electron densities of all the atoms presented within the X-ray beam. There is no equation to correlate the CT number (or the linear attenuation coefficient, electron density, or tissue density) with the MR-contrast numbers; no direct calibration between the two types of signal is possible. This lack of correlation is confirmed by consideration of bone and air which are at opposite ends of the CT contrast (absolute) scale using water as the base-line reference, but which are at the same end of the MR-image contrast (relative) scale owing to their common low proton-population.
The lack of correlation between the CT and MR signals acts against their use in combination for imaging purposes, but the present invention provides a method and system by which the advantages of each may be utilised to improve image resolution and contrast information.
In the latter regard, CT provides a high spatial resolution but only in regard to view normal to the transverse slice. Resolution for all re-constructed non-transverse planes is poor owing to the need to use elongate voxels to improve signal-to-noise ratio. Also, the partial-volume effect of using elongate voxels may give rise to detection errors at the thin edge of a contrast profile of a lesion. MR, on the other hand, can give the same high degree of spatial resolution viewed in the normal direction to any image-slice plane, and can also provide isotropic resolution with cubic-voxel volume imaging.
To this end, multiple-slice transverse CT scans are collected across a section of the volume of interest in a patient or other subject. Corresponding multiple-slice transverse MR scans of the same volume are also collected. The slice thickness of the latter scans may be one half, or smaller, of the thickness of the CT slices, and may be collected two-dimensionally or three-dimensionally. The patient or other object scanned is constrained throughout on a couch that provides landmarks with respect to a coordinate reference arrangement on the couch-top. This is to ensure the reproducibility of, for example, anatomical positions and features to the first order accuracy for the corresponding CT and MR scans, and possibly for radiation treatment to be made.
The respective transverse planes of the CT and MR images are processed individually in the method and are matched with one another in a de-convoluted space for the CT and MR images. The two sets of de-convoluted maps are then merged together to a second order of accuracy in order that the CT numbers may be transferred over to replace the corresponding MR contrast numbers. Once this has been achieved, non-transverse (or oblique) planes can be obtained from the two-dimensional MR images, or from the re-arrangement of the corresponding voxels of the three-dimensional volume images; where two-dimensional MR is used, a further step of contrast transformation may be required.
The respective transverse planes of CT and MR images are processed individually by using ‘boundary’ or ‘finger-print’ matching techniques in a de-convolution space for the CT & MR images. In these transverse image planes, in particular when used medically, the skin-contour features along the sides of the patient may be best used for second-order alignment and matching purposes, as they are less affected by patient-movements. Transitional error may be readily corrected with respect to the coordinate positions of a rectangular tubing system embedded in the couch-top (for example that described above with reference to FIGS. 5 and 6). The processed data may then be used for a ‘diagnostic and statistics software package’ of CT image versus MR image for their exactly corresponding transverse slice(s), and an associated ‘statistical package’ for accurate computation of the ‘true’ area, and then the ‘true’ volume, of a lesion or tissue profile or contour.
The two sets of de-convoluted maps may also be merged together to a second order of accuracy in order that the CT numbers may be transferred over to replace the corresponding MR contrast numbers. Once this has been done, non-transverse (or oblique) planes are obtained from the two-dimensional image or from the re-arrangement of the corresponding voxels of the three-dimensional volume; in the two-dimensional MR case, a further step of contrast transformation is required. The transferred contrast data may then be used in a three-dimensional radiotherapy treatment planning software package for an in-plane, oblique-image pseudo-three-dimensional approach using MR images.
Software required for de-convolution processing of image data according to the invention may be implemented in conjunction with a least-squares curve-fitting method. A mathematical model of the method, from which the required software can be readily developed, will now be given in relation to FIG. 7 which indicates the convolution of an LSF L(x) with a step function SF having a step-down edge SDE, to produce an image ERF E(x). Considering the values of E(x) resulting from the convolution at points x=1 to x=n of SF:
For de-convolution, that is to say, for the ERF E(x) to manifest the LSF L(x):
{E(x)1 −E(x)2 }/Δx=L(x)(a-1)−a
thus:
{E(x)2 −E(x)3 }/Δx=L(x)(a-2)−(a-1)
leading to
{E(x)(n-1) −E(x)n }/Δx=L(x)(n-1)−n
For de-convolution, that is to say, for the ERF E(x) to manifest the LSF L(x):
thus:
{E(x)2 −E(x)3 }/Δx=L(x)(a-2)−(a-1)
leading to
{E(x)(n-1) −E(x)n }/Δx=L(x)(n-1)−n
Thus, the same shape of LSF is recovered by the de-convolution process independently of the sense of-the ERF; it does not matter whether a roll-up or a roll-down ERF of a positive or a negative contrast profile, is involved. This is an important property as a positive contrast contour will have roll-up (from low to high) ERFs at both ends whereas a negative contrast contour will have roll-down (from high to low) ERFs at both ends.
In the practical implementation, the LSF is derived from the ERF by de-convolution using a running filter. This enhances the accuracy of the method in overcoming the problem of noise that affects the digitised pixel values of the image. Use is made of a least-squares fitting of a set of data points that advances along the whole length of the function from one point to another.
Assuming that y=a0+a1x+a2x2 represents the ERF curve a five-point or seven-point fit is used, and the normal equation becomes:
- where: i is 1+n, . . . 5+n; . . . until m−5, . . . m or
- i is 1+n, . . . 7+n; . . . until m−7, . . . m n is 0,1, 2, . . . ; and
- 1, . . . m is the span of the ERF profile.
The solution may be derived from either:
For both of these equations to be valid:
The gradient at dy/dx(3+n) or dy/dx(4+n) can then be derived and plotted against x for the LSF profile.
The graph of dy/dx against x gives the LSF profile. The peak of this profile is located centrally of the mid-points of the ascending and descending limbs of the graph. These points define the extremes of the full-width-half-maximum (FWHM) of the profile and the mid-point of this is determined with an accuracy of sub-pixel level owing to the ‘average’ effect.
The point spread function (PSF) is the two dimensional profile which may be derived, in practice, from the two corresponding LSFs orthogonal to one another within an image plane. The peak position of the PSF profile is, therefore, from the ‘mean’ or ‘cross-over’ of the two peaks or the two LSF profiles. The PSF is obtained in practice from two orthogonal axes in a two-dimensional plane.
The generation of the LSF (or PSF) is, after phase-reversal correction, independent of the roll-up or roll-down nature of ERFs at the edges of the contrast contour. In other words, it is independent of the sense and the absolute value of the contrast numbers within the contour. The peak position of the LSF (or PSF) is the central half-way (50%) point of the roll-up or roll-down ERF which is the optimum position for true-edge definition
Claims (16)
1. An imaging method for enhancing spatial resolution within an image domain of an image edge-response function of a scanned object-discontinuity, the method comprising the steps of:
carrying out a de-convolution process on the image edge-response function to derive from the image edge-response function a spread profile of the respective point-spread function or line-spread function of the image edge-response function, the de-convolution process being carried out with sub-pixel sampling of the image-edge response function;
correlating the spread profile with a profile of the image edge-response function;
identifying within the image domain the location of the object-discontinuity, the location of the object-discontinuity being identified within the image domain by a mid-point of a full-width half-maximum of the spread profile; and
redistributing sub-pixels of the profile of the edge-response function to enhance the spatial resolution of the object-discontinuity within the image domain, the sub-pixels being redistributed between two opposite sides of the identified location of the object-discontinuity in the image domain, by transferring sub-pixels on one of the two sides to the other of the two side of the identified location.
2. The method according to claim 1 , further comprising the step of using low-contrast filtering to remove spurious edges of the image of the object-discontinuity in the image domain.
3. The method according to claim 1 , wherein the object-discontinuity is one of a multiplicity of object-discontinuities of a scanned object, and the method further comprises the step of enhancing the spatial resolution in the image domain of the image edge-response function of each of the object-discontinuities to define an edge-contour of the object within the image domain.
4. The method according to claim 3 , further comprising the step of determining the intensity within the edge-contour of the object within the image domain.
5. The method according to claim 1 , further comprising the step of carrying out the de-convolution process using least-squares running filtering.
6. The method according to claim 3 , further comprising the step of determining the area of the object-image within the edge-contour.
7. The method according to claim 3 , further comprising the step of determining the volume of the object-image within the edge-contour.
8. The method according to claim 3 , further comprising the step of scanning the scanned object via a magnetic resonance (MR) scan, values of relaxation times T1 and T2 are derived for the image of the object within said contour, and these values are used to identify from stored data, types of material involved in the scanned object.
9. The method according to claim 8 , further comprising the step of deriving density values for the identified types of material from further stored data.
10. The method according to claim 1 , further comprising the step of deriving corresponding computed tomography (CT) and magnetic resonance (MR) scans of the same part of an object, the scans are related to one another for correlation of one to the other positionally with respect to said part using the de-convolution process, and imaging of said part of the object is provided in accordance with the MR-scan image as modified spatially in dependence upon the CT contrast numbers applicable to the corresponding, correlated positions of the CT scan.
11. The method according to claim 10 , further comprising the step of applying geometric correction to the imaging of said part in accordance with stored data.
12. An imaging system for enhancing spatial resolution within an image domain of an image edge-response function of a scanned object-discontinuity, the system comprising:
means for carrying out a de-convolution process on the image edge-response function to derive from the image edge-response function a spread profile of the respective point-spread function or a line-spread function of the image edge-response function, the de-convolution process being carried out with sub-pixel sampling of the image-edge response function;
means for correlating the spread profile with a profile of the image edge-response function;
means for identifying within the image domain the location of the object-discontinuity, the location of the object-discontinuity being identified within the image domain by a mid-point of a full-width half-maximum of the spread profile; and
means for redistributing sub-pixels of the profile of the edge-response function to enhance the spatial resolution of the object-discontinuity within the image domain, the sub-pixels being redistributed between two opposite sides of the identified location of the object-discontinuity in the image domain, by transferring sub-pixels on one of the two sides to the other of the two side of the identified location.
13. The imaging system according to claim 12 , wherein the means for carrying out the de-convolution process is a least-squares running filter.
14. A method of imaging in which a de-convolution process is applied to image-domain results of an object-scan to derive therefrom a respective point-spread function or a line-spread function of at least one object-discontinuity, and to derive from said function a location in the image domain of the respective discontinuity;
the method comprising the step of:
carrying out the de-convolution process out using sub-pixel sampling; and
correlating the function with the image-domain results of the object-scan for enhancement of spatial resolution of the imaging of the respective discontinuity, and the enhancement of spatial resolution of the imaging of the respective discontinuity involves transfer of subpixels within the image-domain results of the respective discontinuity, the sub-pixels being transferred within their respective image-domain results from one side to the other of the location for edge-image definition.
15. The method according to claim 14 , further comprises the steps of enhancing the spatial resolution of the image-edge response functions that result respectively from a magnetic resonance (MR) scan and a computed tomography (CT) scan of the object-discontinuity, correlating the enhanced image-edge response functions of the MR and CT scans with one another, deriving from the enhanced image-edge response function of the CT scan, CT contrast numbers for respective parts of the object-discontinuity, and providing modified imaging of the parts of the object-discontinuity, the modified imaging being provided from the respective parts of the MR scan modified by the CT contrast numbers for those respective parts.
16. An imaging system comprising means for performing a de-convolution process on image-domain results of an object-scan to derive therefrom a respective point-spread function or a line-spread function of at least one object-discontinuity, and a mechanism to derive from the function a location in the image domain of the respective discontinuity;
wherein the de-convolution process is carried out using sub-pixel sampling; and
the function is correlated with the image-domain results of the object-scan for enhancement of spatial resolution of the imaging of the respective discontinuity, the enhancement of spatial resolution of the imaging of the respective discontinuity involves transfer of sub-pixels within the image-domain results of the respective discontinuity, the sub-pixels being transferred within their respective image-domain results from one side to the other of the location for edge-image definition.
Applications Claiming Priority (4)
| Application Number | Priority Date | Filing Date | Title |
|---|---|---|---|
| GBGB9822397.7A GB9822397D0 (en) | 1998-10-15 | 1998-10-15 | Imaging |
| GBGB9825165.5A GB9825165D0 (en) | 1998-11-18 | 1998-11-18 | Imaging |
| GBGB9902332.7A GB9902332D0 (en) | 1999-02-02 | 1999-02-02 | Imaging |
| PCT/GB1999/003417 WO2000022573A1 (en) | 1998-10-15 | 1999-10-15 | Imaging |
Publications (1)
| Publication Number | Publication Date |
|---|---|
| US6928182B1 true US6928182B1 (en) | 2005-08-09 |
Family
ID=27269515
Family Applications (1)
| Application Number | Title | Priority Date | Filing Date |
|---|---|---|---|
| US09/807,396 Expired - Fee Related US6928182B1 (en) | 1998-10-15 | 1999-10-05 | Imaging |
Country Status (9)
| Country | Link |
|---|---|
| US (1) | US6928182B1 (en) |
| EP (1) | EP1121663B1 (en) |
| JP (1) | JP4309062B2 (en) |
| AT (1) | ATE286283T1 (en) |
| AU (1) | AU768756B2 (en) |
| CA (1) | CA2346852A1 (en) |
| DE (1) | DE69922983T2 (en) |
| GB (1) | GB2346028B (en) |
| WO (1) | WO2000022573A1 (en) |
Cited By (21)
| Publication number | Priority date | Publication date | Assignee | Title |
|---|---|---|---|---|
| US20030095693A1 (en) * | 2001-11-20 | 2003-05-22 | Acculmage Diagnostics Corp. | Method and software for improving coronary calcium scoring consistency |
| US20050063611A1 (en) * | 2003-09-24 | 2005-03-24 | Yuusuke Toki | Super-resolution processor and medical diagnostic imaging apparatus |
| US20050220357A1 (en) * | 2003-07-31 | 2005-10-06 | Toshihiro Rifu | Image enhancement or correction software, method, apparatus and system for substantially minimizing blur in the scanned image |
| US20060159319A1 (en) * | 2005-01-20 | 2006-07-20 | Scimed Life Systems, Inc. | Pattern recognition systems and methods |
| US7149331B1 (en) | 2002-09-03 | 2006-12-12 | Cedara Software Corp. | Methods and software for improving thresholding of coronary calcium scoring |
| US7215732B2 (en) * | 2004-09-30 | 2007-05-08 | General Electric Company | Method and system for CT reconstruction with pre-correction |
| US20070172141A1 (en) * | 2006-01-23 | 2007-07-26 | Yosuke Bando | Image conversion device, image conversion method, and recording medium |
| US20070280519A1 (en) * | 2004-03-22 | 2007-12-06 | Hagen Spies | Method, Computer Program Product And Apparatus For Enhancing A Computerized Tomography Image |
| US20080075379A1 (en) * | 2006-09-21 | 2008-03-27 | Konica Minolta Medical & Graphic, Inc. | Image processing device and image processing method |
| US20080073567A1 (en) * | 2006-09-22 | 2008-03-27 | Konica Minolta Medical & Graphic, Inc. | Radiological image capturing system and radiological image capturing method |
| US20080089565A1 (en) * | 2004-10-15 | 2008-04-17 | Chui Kui M | Pattern Matching |
| US20080175508A1 (en) * | 2007-01-22 | 2008-07-24 | Kabushiki Kaisha Toshiba | Image Processing Device |
| US20080315105A1 (en) * | 2002-10-16 | 2008-12-25 | Partain Larry D | Method and Apparatus for Correcting Excess Signals in an Imaging System |
| DE102009015594A1 (en) * | 2009-03-30 | 2010-10-14 | Carl Zeiss Sms Gmbh | Method and device for subpixel accurate position determination of an edge of a marker structure in a plurality of receiving pixels having recording of the marker structure |
| US20120249362A1 (en) * | 2011-03-29 | 2012-10-04 | Victor Gorelik | Method for obtaining object-plane field from its two images |
| CN101846798B (en) * | 2009-03-24 | 2013-02-27 | 财团法人工业技术研究院 | Method and device for acquiring scene depth information |
| WO2014074138A1 (en) * | 2012-11-09 | 2014-05-15 | Nikon Corporation | Globally dominant point spread function estimation |
| US8922641B2 (en) | 2011-06-29 | 2014-12-30 | The Procter & Gamble Company | System and method for inspecting components of hygienic articles |
| US9530079B2 (en) | 2012-11-09 | 2016-12-27 | Nikon Corporation | Point spread function classification using structural properties |
| US9779491B2 (en) | 2014-08-15 | 2017-10-03 | Nikon Corporation | Algorithm and device for image processing |
| US9792673B2 (en) * | 2015-09-25 | 2017-10-17 | Intel Corporation | Facilitating projection pre-shaping of digital images at computing devices |
Families Citing this family (5)
| Publication number | Priority date | Publication date | Assignee | Title |
|---|---|---|---|---|
| FR2867935A1 (en) * | 2004-03-17 | 2005-09-23 | Thomson Licensing Sa | METHOD FOR INCREASING CONTOURS IN AN IMAGE |
| JP4891721B2 (en) * | 2006-09-28 | 2012-03-07 | 日立アロカメディカル株式会社 | Ultrasonic diagnostic equipment |
| CN103565473A (en) | 2012-07-27 | 2014-02-12 | 三星电子株式会社 | Image processing module and image processing method |
| CN104248437B (en) * | 2014-10-15 | 2017-04-12 | 中国科学院深圳先进技术研究院 | Method and system for dynamic magnetic resonance imaging |
| EP4012662A1 (en) * | 2020-12-09 | 2022-06-15 | Koninklijke Philips N.V. | Method for identifying a material boundary in volumetric image data |
Citations (17)
| Publication number | Priority date | Publication date | Assignee | Title |
|---|---|---|---|---|
| GB2155187A (en) | 1984-02-27 | 1985-09-18 | Picker Int Ltd | Nuclear magnetic resonance imaging apparatus |
| EP0159780A1 (en) | 1984-02-27 | 1985-10-30 | Picker International Limited | Nuclear magnetic resonance imaging apparatus |
| US4947323A (en) | 1986-05-22 | 1990-08-07 | University Of Tennessee Research Corporation | Method and apparatus for measuring small spatial dimensions of an object |
| US4973111A (en) | 1988-09-14 | 1990-11-27 | Case Western Reserve University | Parametric image reconstruction using a high-resolution, high signal-to-noise technique |
| GB2235779A (en) | 1989-08-08 | 1991-03-13 | Nat Res Dev | ECHO PLANAR IMAGING USING 180ì PULSES |
| US5001429A (en) | 1989-11-21 | 1991-03-19 | General Electric Company | Removal of truncation artifacts in NMR imaging |
| US5150292A (en) * | 1989-10-27 | 1992-09-22 | Arch Development Corporation | Method and system for determination of instantaneous and average blood flow rates from digital angiograms |
| US5445155A (en) | 1991-03-13 | 1995-08-29 | Scimed Life Systems Incorporated | Intravascular imaging apparatus and methods for use and manufacture |
| US5576548A (en) * | 1995-06-05 | 1996-11-19 | University Of South Florida | Nuclear imaging enhancer |
| US5594767A (en) | 1995-11-02 | 1997-01-14 | General Electric Company | Methods and apparatus for enhancing image sharpness |
| JPH0962836A (en) | 1995-08-25 | 1997-03-07 | Ge Yokogawa Medical Syst Ltd | Picture processing method and picture processor |
| JPH09153141A (en) | 1995-11-29 | 1997-06-10 | Toshiba Corp | Picture processor and picture processing method |
| US5784492A (en) | 1995-03-16 | 1998-07-21 | Trustees Of Boston University | Apparatus and method for data compression with the CLEAN technique |
| US5790692A (en) * | 1994-09-07 | 1998-08-04 | Jeffrey H. Price | Method and means of least squares designed filters for image segmentation in scanning cytometry |
| US6166801A (en) * | 1998-07-14 | 2000-12-26 | Nova Measuring Instruments, Ltd. | Monitoring apparatus and method particularly useful in photolithographically processing substrates |
| US20020186874A1 (en) * | 1994-09-07 | 2002-12-12 | Jeffrey H. Price | Method and means for image segmentation in fluorescence scanning cytometry |
| US6603529B1 (en) * | 1998-07-14 | 2003-08-05 | Nova Measuring Instruments Ltd. | Monitoring apparatus and method particularly useful in photolithographically processing substrates |
-
1999
- 1999-10-05 US US09/807,396 patent/US6928182B1/en not_active Expired - Fee Related
- 1999-10-15 AU AU63503/99A patent/AU768756B2/en not_active Ceased
- 1999-10-15 JP JP2000576410A patent/JP4309062B2/en not_active Expired - Fee Related
- 1999-10-15 EP EP99950910A patent/EP1121663B1/en not_active Expired - Lifetime
- 1999-10-15 AT AT99950910T patent/ATE286283T1/en not_active IP Right Cessation
- 1999-10-15 WO PCT/GB1999/003417 patent/WO2000022573A1/en active IP Right Grant
- 1999-10-15 CA CA002346852A patent/CA2346852A1/en not_active Abandoned
- 1999-10-15 DE DE69922983T patent/DE69922983T2/en not_active Expired - Fee Related
- 1999-10-15 GB GB9924530A patent/GB2346028B/en not_active Expired - Fee Related
Patent Citations (17)
| Publication number | Priority date | Publication date | Assignee | Title |
|---|---|---|---|---|
| GB2155187A (en) | 1984-02-27 | 1985-09-18 | Picker Int Ltd | Nuclear magnetic resonance imaging apparatus |
| EP0159780A1 (en) | 1984-02-27 | 1985-10-30 | Picker International Limited | Nuclear magnetic resonance imaging apparatus |
| US4947323A (en) | 1986-05-22 | 1990-08-07 | University Of Tennessee Research Corporation | Method and apparatus for measuring small spatial dimensions of an object |
| US4973111A (en) | 1988-09-14 | 1990-11-27 | Case Western Reserve University | Parametric image reconstruction using a high-resolution, high signal-to-noise technique |
| GB2235779A (en) | 1989-08-08 | 1991-03-13 | Nat Res Dev | ECHO PLANAR IMAGING USING 180ì PULSES |
| US5150292A (en) * | 1989-10-27 | 1992-09-22 | Arch Development Corporation | Method and system for determination of instantaneous and average blood flow rates from digital angiograms |
| US5001429A (en) | 1989-11-21 | 1991-03-19 | General Electric Company | Removal of truncation artifacts in NMR imaging |
| US5445155A (en) | 1991-03-13 | 1995-08-29 | Scimed Life Systems Incorporated | Intravascular imaging apparatus and methods for use and manufacture |
| US20020186874A1 (en) * | 1994-09-07 | 2002-12-12 | Jeffrey H. Price | Method and means for image segmentation in fluorescence scanning cytometry |
| US5790692A (en) * | 1994-09-07 | 1998-08-04 | Jeffrey H. Price | Method and means of least squares designed filters for image segmentation in scanning cytometry |
| US5784492A (en) | 1995-03-16 | 1998-07-21 | Trustees Of Boston University | Apparatus and method for data compression with the CLEAN technique |
| US5576548A (en) * | 1995-06-05 | 1996-11-19 | University Of South Florida | Nuclear imaging enhancer |
| JPH0962836A (en) | 1995-08-25 | 1997-03-07 | Ge Yokogawa Medical Syst Ltd | Picture processing method and picture processor |
| US5594767A (en) | 1995-11-02 | 1997-01-14 | General Electric Company | Methods and apparatus for enhancing image sharpness |
| JPH09153141A (en) | 1995-11-29 | 1997-06-10 | Toshiba Corp | Picture processor and picture processing method |
| US6166801A (en) * | 1998-07-14 | 2000-12-26 | Nova Measuring Instruments, Ltd. | Monitoring apparatus and method particularly useful in photolithographically processing substrates |
| US6603529B1 (en) * | 1998-07-14 | 2003-08-05 | Nova Measuring Instruments Ltd. | Monitoring apparatus and method particularly useful in photolithographically processing substrates |
Non-Patent Citations (4)
| Title |
|---|
| Alperin N. et al.: "Automated Analysis of Coronary Lesions from Cineangiograms Using Vessel Tracking and Iterative Deconvolution Techniques" Proceedings of the Computers in Cardiology Meeting, US, Washington, IEEE Comp. Soc. Press, vol. Meeting 16, Oct. 16, 1989 p. 153-156 XO000147033 ISBN: 0-8186-2114-1. |
| Alperin, k. R. Hoffman, Automated analysis of coronary lesions from cineangiograms using vessel tracking and iterative deconvolution techniques, 1999, IEEE,p. 153-156. * |
| Charland P. et al.: "The Use of Deconvolution and Total Least Squares in Recovering a Radition Detector Line Spread Function" Medical Physics, US, American Institute of Physics, New York, vol. 25, No. 2, Feb. 1998, p. 152-160 XP000833821, ISSN: 0094-2405. |
| Marsuki Kisworo et al.: "2-D Edge Feature Extraction to Subpixel Accuracy Using the Generalized Energy Approach" Proceeding of the International Conference on EC3-Energy, Computer, Communication and Control Systems (TENCON), US, New York, IEEE, Aug. 2, 1991, p. 344-348 XP000333363 ISBN: 0-7803-0539-. |
Cited By (39)
| Publication number | Priority date | Publication date | Assignee | Title |
|---|---|---|---|---|
| US20030095693A1 (en) * | 2001-11-20 | 2003-05-22 | Acculmage Diagnostics Corp. | Method and software for improving coronary calcium scoring consistency |
| US7127096B2 (en) * | 2001-11-20 | 2006-10-24 | Accuimage Diagnostics Corp. | Method and software for improving coronary calcium scoring consistency |
| US7409035B2 (en) | 2001-11-20 | 2008-08-05 | Cedara Software (Usa) Limited | Phantom for improving coronary calcium scoring consistency |
| US20050281478A1 (en) * | 2001-11-20 | 2005-12-22 | Accuimage Diagnostics Corporation | Method and software for improving coronary calcium scoring consistency |
| US7149331B1 (en) | 2002-09-03 | 2006-12-12 | Cedara Software Corp. | Methods and software for improving thresholding of coronary calcium scoring |
| US8658960B2 (en) | 2002-10-16 | 2014-02-25 | Varian Medical Systems, Inc. | Method and apparatus for correcting excess signals in an imaging system |
| US8049156B2 (en) | 2002-10-16 | 2011-11-01 | Varian Medical Systems, Inc. | Method and apparatus for excess signal correction in an imager |
| US20100118166A1 (en) * | 2002-10-16 | 2010-05-13 | Partain Larry D | Method and apparatus for excess signal correction in an imager |
| US7638752B2 (en) | 2002-10-16 | 2009-12-29 | Varian Medical Systems, Inc. | Method and apparatus for correcting excess signals in an imaging system |
| US20080315105A1 (en) * | 2002-10-16 | 2008-12-25 | Partain Larry D | Method and Apparatus for Correcting Excess Signals in an Imaging System |
| US7330594B2 (en) * | 2003-07-31 | 2008-02-12 | Kabushiki Kaisha Toshiba | Image enhancement or correction software, method, apparatus and system for substantially minimizing blur in the scanned image |
| US20050220357A1 (en) * | 2003-07-31 | 2005-10-06 | Toshihiro Rifu | Image enhancement or correction software, method, apparatus and system for substantially minimizing blur in the scanned image |
| US20050063611A1 (en) * | 2003-09-24 | 2005-03-24 | Yuusuke Toki | Super-resolution processor and medical diagnostic imaging apparatus |
| US7492967B2 (en) * | 2003-09-24 | 2009-02-17 | Kabushiki Kaisha Toshiba | Super-resolution processor and medical diagnostic imaging apparatus |
| US20070280519A1 (en) * | 2004-03-22 | 2007-12-06 | Hagen Spies | Method, Computer Program Product And Apparatus For Enhancing A Computerized Tomography Image |
| US7809178B2 (en) * | 2004-03-22 | 2010-10-05 | Contextvision Ab | Method, computer program product and apparatus for enhancing a computerized tomography image |
| US7215732B2 (en) * | 2004-09-30 | 2007-05-08 | General Electric Company | Method and system for CT reconstruction with pre-correction |
| US20080089565A1 (en) * | 2004-10-15 | 2008-04-17 | Chui Kui M | Pattern Matching |
| US7778450B2 (en) * | 2005-01-20 | 2010-08-17 | Scimed Life Systems, Inc. | Pattern recognition systems and methods |
| US20060159319A1 (en) * | 2005-01-20 | 2006-07-20 | Scimed Life Systems, Inc. | Pattern recognition systems and methods |
| US20070172141A1 (en) * | 2006-01-23 | 2007-07-26 | Yosuke Bando | Image conversion device, image conversion method, and recording medium |
| US7860336B2 (en) | 2006-01-23 | 2010-12-28 | Kabushiki Kaisha Toshiba | Image conversion device, image conversion method, and recording medium |
| US20080075379A1 (en) * | 2006-09-21 | 2008-03-27 | Konica Minolta Medical & Graphic, Inc. | Image processing device and image processing method |
| US20080073567A1 (en) * | 2006-09-22 | 2008-03-27 | Konica Minolta Medical & Graphic, Inc. | Radiological image capturing system and radiological image capturing method |
| US20080175508A1 (en) * | 2007-01-22 | 2008-07-24 | Kabushiki Kaisha Toshiba | Image Processing Device |
| US8358865B2 (en) | 2007-01-22 | 2013-01-22 | Kabushiki Kaisha Toshiba | Device and method for gradient domain image deconvolution |
| CN101846798B (en) * | 2009-03-24 | 2013-02-27 | 财团法人工业技术研究院 | Method and device for acquiring scene depth information |
| DE102009015594B4 (en) * | 2009-03-30 | 2015-07-30 | Carl Zeiss Sms Gmbh | Method and device for subpixel accurate position determination of an edge of a marker structure in a plurality of receiving pixels having recording the marker structure |
| US8457411B2 (en) | 2009-03-30 | 2013-06-04 | Carl Zeiss Sms Gmbh | Method and device for determining the position of an edge of a marker structure with subpixel accuracy in an image, having a plurality of pixels, of the marker structure |
| DE102009015594A1 (en) * | 2009-03-30 | 2010-10-14 | Carl Zeiss Sms Gmbh | Method and device for subpixel accurate position determination of an edge of a marker structure in a plurality of receiving pixels having recording of the marker structure |
| US8362947B2 (en) * | 2011-03-29 | 2013-01-29 | Victor Gorelik | Method for obtaining object-plane field from its two images |
| US20120249362A1 (en) * | 2011-03-29 | 2012-10-04 | Victor Gorelik | Method for obtaining object-plane field from its two images |
| US8922641B2 (en) | 2011-06-29 | 2014-12-30 | The Procter & Gamble Company | System and method for inspecting components of hygienic articles |
| WO2014074138A1 (en) * | 2012-11-09 | 2014-05-15 | Nikon Corporation | Globally dominant point spread function estimation |
| US9530079B2 (en) | 2012-11-09 | 2016-12-27 | Nikon Corporation | Point spread function classification using structural properties |
| US9589328B2 (en) | 2012-11-09 | 2017-03-07 | Nikon Corporation | Globally dominant point spread function estimation |
| US9779491B2 (en) | 2014-08-15 | 2017-10-03 | Nikon Corporation | Algorithm and device for image processing |
| US10339643B2 (en) | 2014-08-15 | 2019-07-02 | Nikon Corporation | Algorithm and device for image processing |
| US9792673B2 (en) * | 2015-09-25 | 2017-10-17 | Intel Corporation | Facilitating projection pre-shaping of digital images at computing devices |
Also Published As
| Publication number | Publication date |
|---|---|
| JP4309062B2 (en) | 2009-08-05 |
| JP2002527834A (en) | 2002-08-27 |
| AU768756B2 (en) | 2004-01-08 |
| EP1121663B1 (en) | 2004-12-29 |
| GB2346028B (en) | 2003-03-05 |
| EP1121663A1 (en) | 2001-08-08 |
| GB2346028A (en) | 2000-07-26 |
| DE69922983D1 (en) | 2005-02-03 |
| CA2346852A1 (en) | 2000-04-20 |
| WO2000022573A1 (en) | 2000-04-20 |
| AU6350399A (en) | 2000-05-01 |
| ATE286283T1 (en) | 2005-01-15 |
| DE69922983T2 (en) | 2005-12-29 |
| GB9924530D0 (en) | 1999-12-15 |
Similar Documents
| Publication | Publication Date | Title |
|---|---|---|
| US6928182B1 (en) | Imaging | |
| Holden et al. | Voxel similarity measures for 3-D serial MR brain image registration | |
| US7480399B2 (en) | Apparatus and method for determining measure of similarity between images | |
| EP1316919B1 (en) | Method for contrast-enhancement of digital portal images | |
| US8553961B2 (en) | Automatic pre-alignment for registration of medical images | |
| US7120276B1 (en) | Method and apparatus for image processing | |
| US20030097076A1 (en) | Method and apparatus for calculating index concerning local blood flow circulations | |
| EP1385018B1 (en) | Correcting geometry and intensity distortions in MR data | |
| US20070014468A1 (en) | System and method for confidence measures for mult-resolution auto-focused tomosynthesis | |
| Van Herk et al. | Automatic registration of pelvic computed tomography data and magnetic resonance scans including a full circle method for quantitative accuracy evaluation | |
| Munbodh et al. | Automated 2D‐3D registration of a radiograph and a cone beam CT using line‐segment enhancement a | |
| Malsch et al. | An enhanced block matching algorithm for fast elastic registration in adaptive radiotherapy | |
| EP1956553A1 (en) | Visual enhancement of interval changes using a temporal subtraction technique. | |
| US8577101B2 (en) | Change assessment method | |
| US7433086B2 (en) | Edge detection and correcting system and method | |
| EP1956554A1 (en) | Visual enhancement of interval changes using a temporal subtraction technique | |
| EP1956552A1 (en) | Visual enhancement of interval changes using a temporal subtraction technique | |
| de Munck et al. | Registration of MR and SPECT without using external fiducial markers | |
| Maya et al. | Image contrast improvement in image fusion between CT and MRI images of brain cancer patients | |
| Fei et al. | Three-dimensional warping registration of the pelvis and prostate | |
| Somasundaram et al. | A novel technique for finding the boundary between the cerebral hemispheres from MR axial head scans | |
| Hillergren | Towards non-invasive Gleason grading of prostate cancer using diffusion weighted MRI | |
| Hong et al. | Intensity-based registration and combined visualization of multimodal brain images for noninvasive epilepsy surgery planning | |
| WO2022223584A1 (en) | Method and system for medical image registration | |
| Radau et al. | Constrained localized-warping-reduced registration errors due to lesions in functional neuroimages |
Legal Events
| Date | Code | Title | Description |
|---|---|---|---|
| FPAY | Fee payment |
Year of fee payment: 4 |
|
| FPAY | Fee payment |
Year of fee payment: 8 |
|
| REMI | Maintenance fee reminder mailed | ||
| LAPS | Lapse for failure to pay maintenance fees |
Free format text: PATENT EXPIRED FOR FAILURE TO PAY MAINTENANCE FEES (ORIGINAL EVENT CODE: EXP.) |
|
| STCH | Information on status: patent discontinuation |
Free format text: PATENT EXPIRED DUE TO NONPAYMENT OF MAINTENANCE FEES UNDER 37 CFR 1.362 |
|
| FP | Lapsed due to failure to pay maintenance fee |
Effective date: 20170809 |